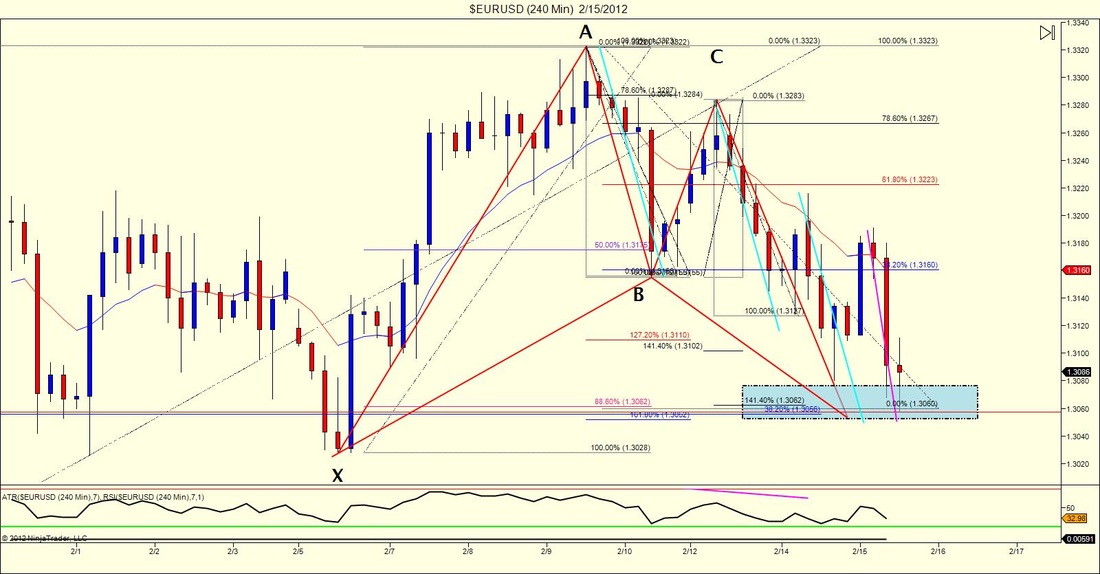
If there were ever a trade where we could predict a zone that the market would struggle to break through this would be it. Here is a chart of the EURUSD that we identified yesterday in the Live Room. As you can see by the chart there is a lot going on. We have a bullish bat pattern in red, a four drives pattern in light blue and even an ab=cd at the end. Hmmm...and guess what, they all end in the same area. I probably could have thrown a few more fibs on there to make it look even better but that would simply make this chart even more crowded than it always is.


 RSS Feed