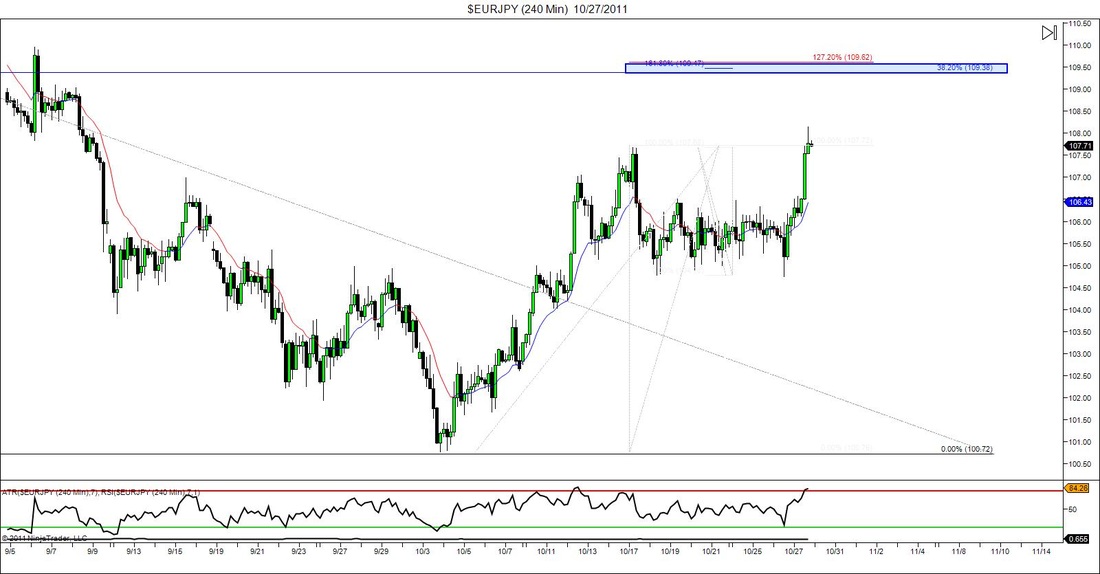
It has been awhile since I've posted anything, but in all honesty there hasn't been much going on in the market, unless you're a channel trader, then you've probably had a field day with some of these pairs. Anyway, things finally seemed to start moving again over the past few days and while going through my PM analysis I noticed a potential reversal zone to watch on this chart. Now in no way am I saying or predicting that the market will indeed reverse at this point but there is some interesting Fibonacci ratio confluence between the 109.40's & 109.60's area. The Fibs I took were a the 1.272 extension the the most recent up move (A-B) & a 1.618 inversion of the retracement of that move (C-B). There is also a 0.382 retracement of the latest down move measured from a daily chart. Obviously you can't see it on this chart but trust me it's there. Do I have a sell limit placed at this zone?....Nope. But I will be keeping my eye on it and keep building my entry reasons as/if price action decides to reach it. There is some minor support near that zone as well which is a plus, but on the down side, if this pattern decides to complete a C-D move that is equal to A-B (giving us an AB=CD pattern) then that will take us to a much higher level which has some very good structure of it's own. We'l just have to wait and see what happens.


 RSS Feed