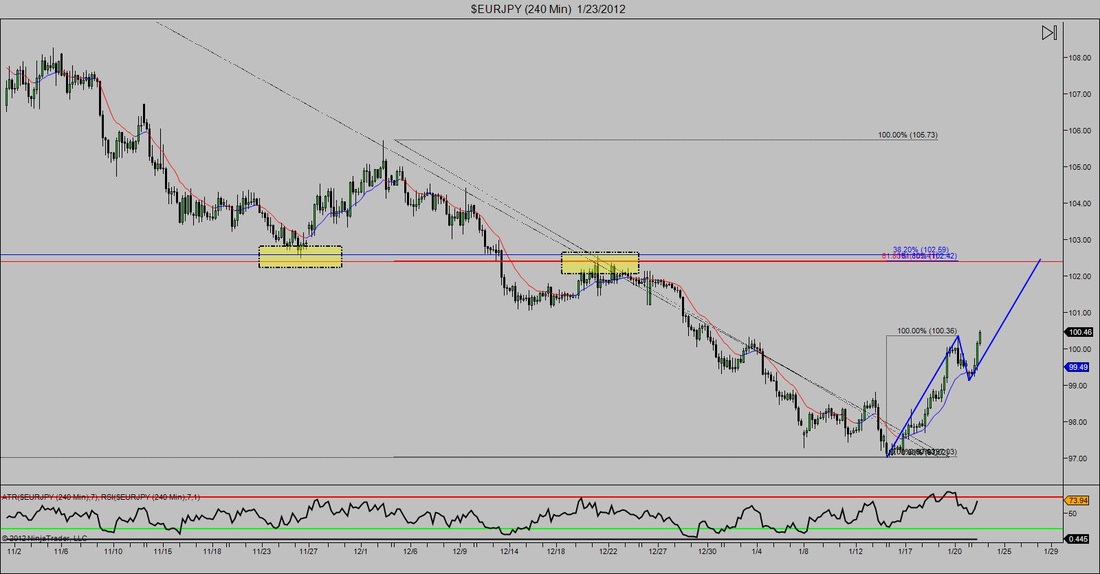
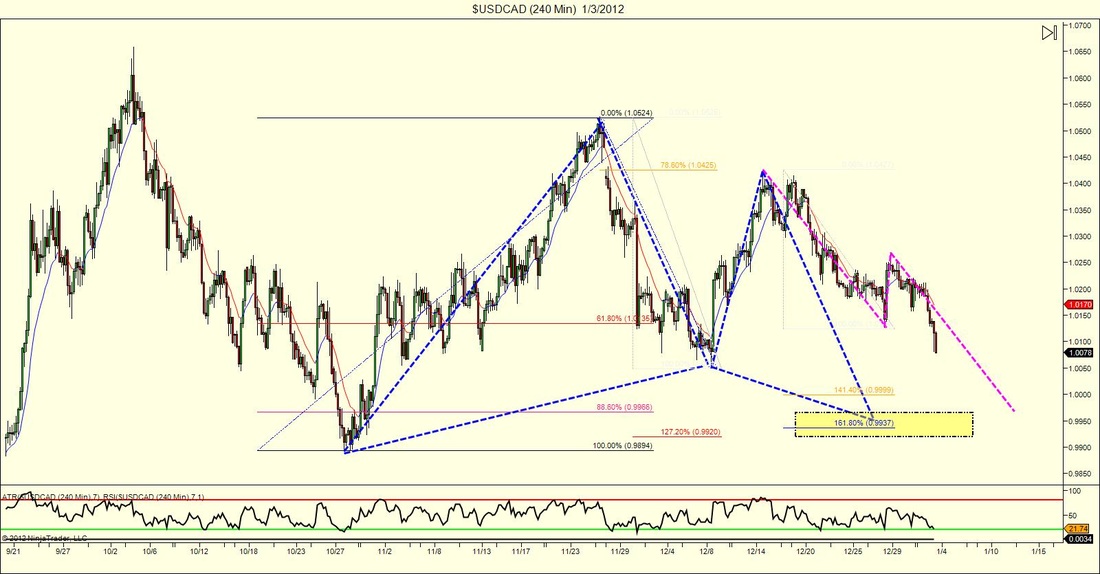
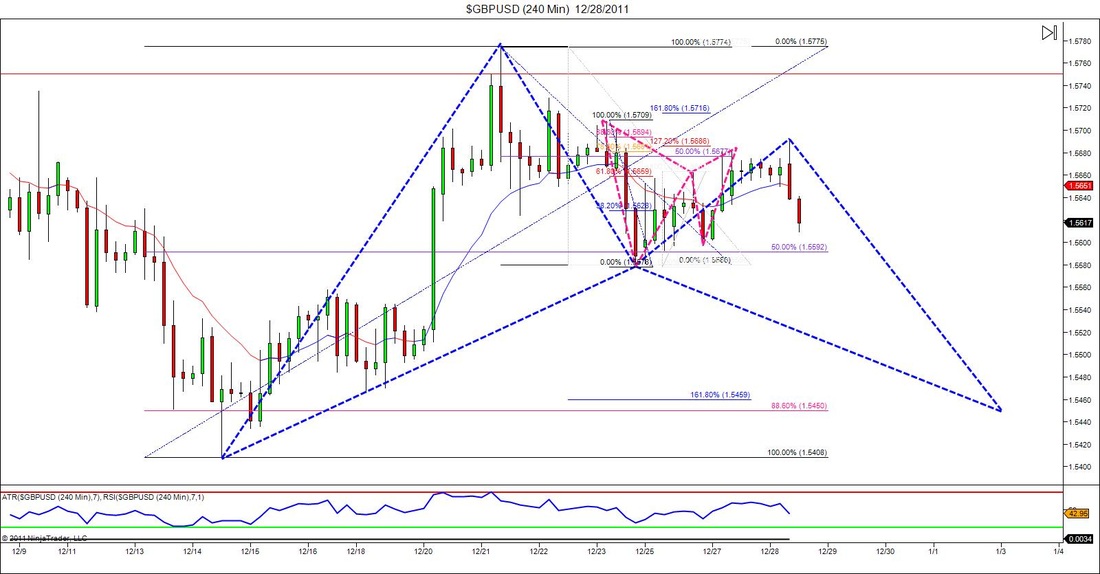
This chart sort of speaks for itself. It's difficult to see since I didn't zoom all the way out but as you can see, there are about 3 Fib points (2 retracements & 1 extension) lining up at the same level. Add to that there is also a potential ABCD pattern completion at the same level. Scroll left and you'll begin to see a few structural levels around that potential reversal area as well. Needless to say the market is giving us a key area to watch, the only question is do we enter? And if so how do we enter? I can't answer that question for you since we all use different rules, but hopefully we'll all get the opportunity to make some money if the market does give us reason at this point. When going through my charts this morning I noticed a few pairs with similar setups as well.
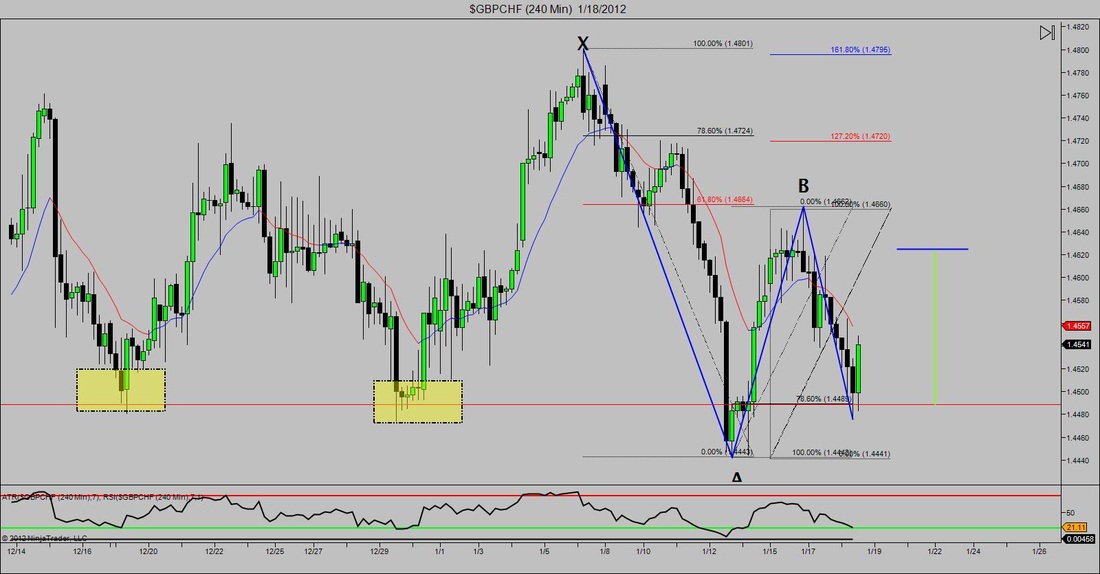
Below is an example of a setup that many traders (well at least traders familiar with the T2T bootcamp) know as being an aggressive "c" buy. Basically on a trade like this your predicting the completion of an advanced pattern and jumping on the train early. What makes it aggressive is that we have no idea whether the pattern is going to complete or not. However, if you look left there is some pretty good structure lined up exactly at where price action hesitated at, along with a fib retracement. So far the trade looks pretty good, but as we know, there is no telling what the market will do second to second so we'll have to
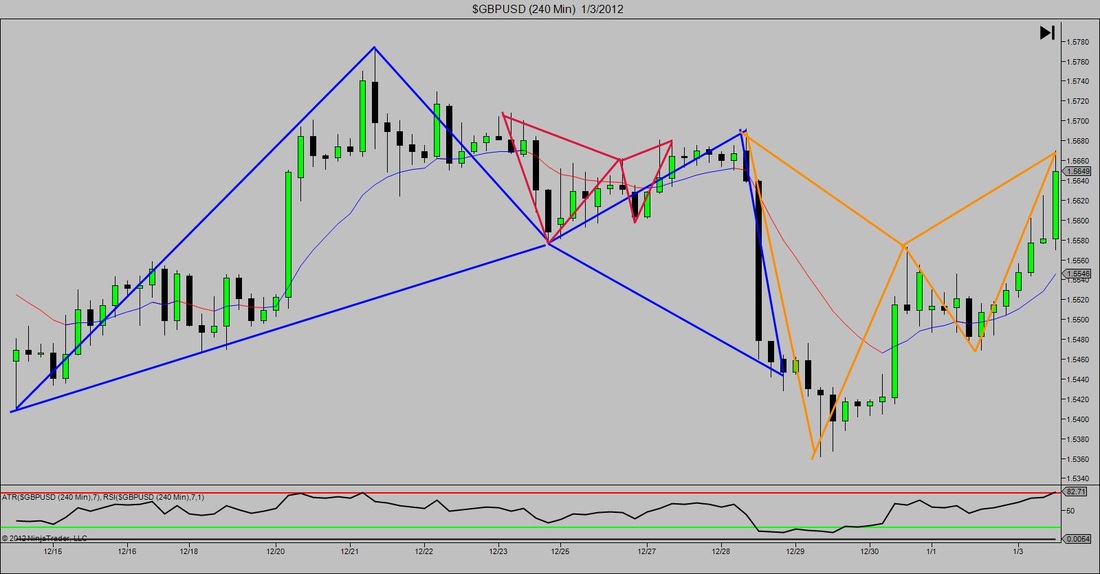
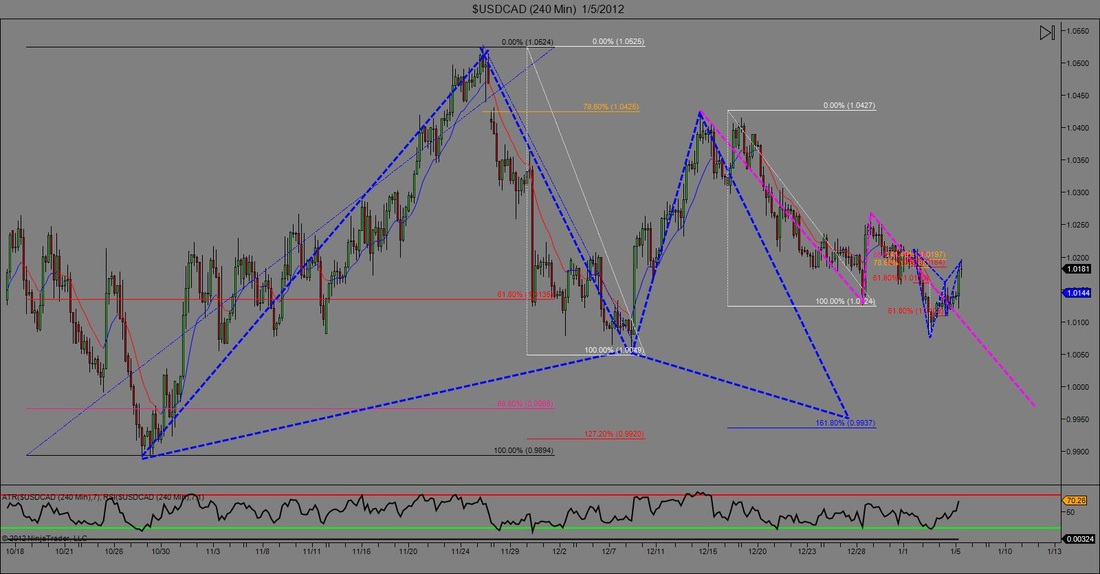
Above is a pretty cool image that I noticed today while showing some trading examples during the Live Room. What's funny is that I noticed all three of these patterns separately when they were forming, and I was actually involved in one, but I never drew them all out together, I personally think it's really cool how the market moves and action like this really makes you believe in the power of technical analysis and market harmonics. Even though its in the middle the red pattern was the first to occur which was a gartley pattern. That gartley then completed into a bat pattern entry, which then completed and formed another gartley. Imagine the profits available for somebody that was able to hop on board all three. CRAZ
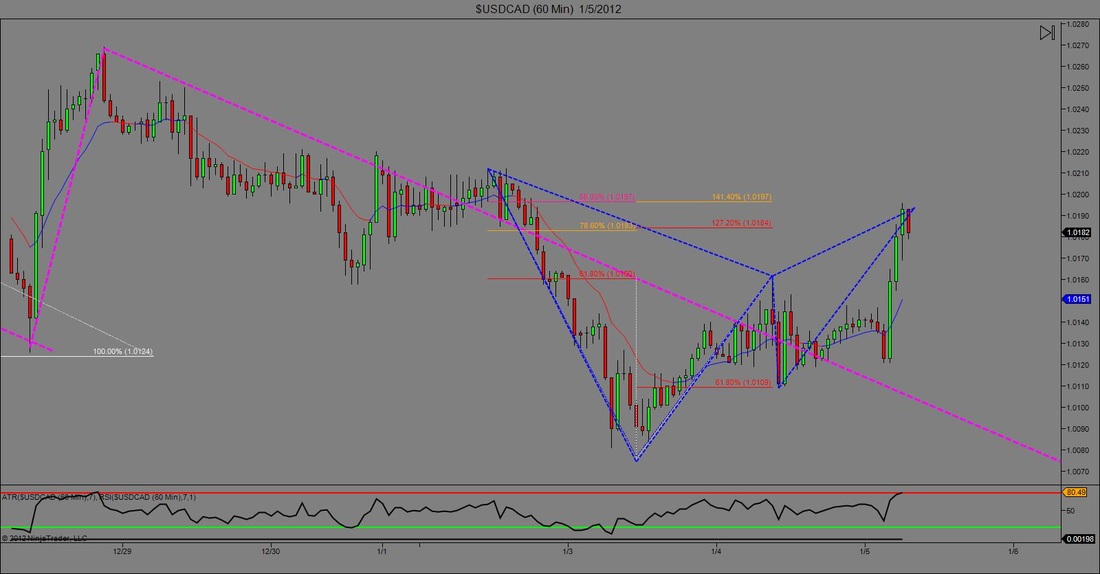
Looking at the USDCAD I see multiple signals that give me a good reason to eventually get long on. I've been looking out for a Gartley pattern since December. It's not the prettiest thing in the world but it does offer a better risk reward ratio if it does complete. When looking my charts this morning i also noticed an AB=CD pattern that would complete around the same area. One of the things that moves the market it trader psychology, so seeing 2 different signals that complete at the same area, give me a little more confidence (not that it matters) that if price action does reach this point, it may turn around.
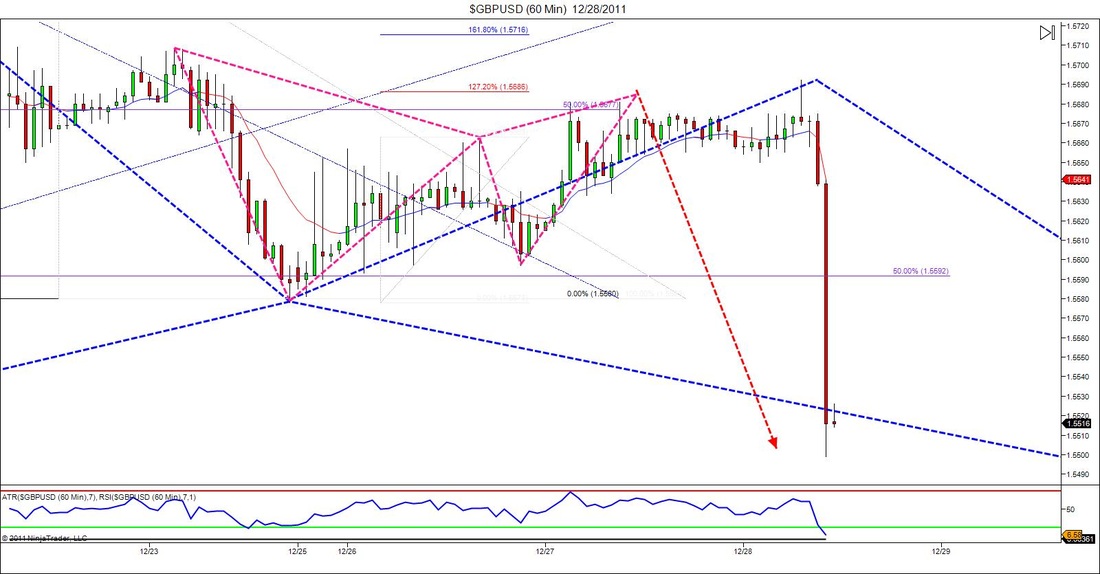
Here is a quick follow up to the post I wrote earlier. I don't think anymore needs to be said
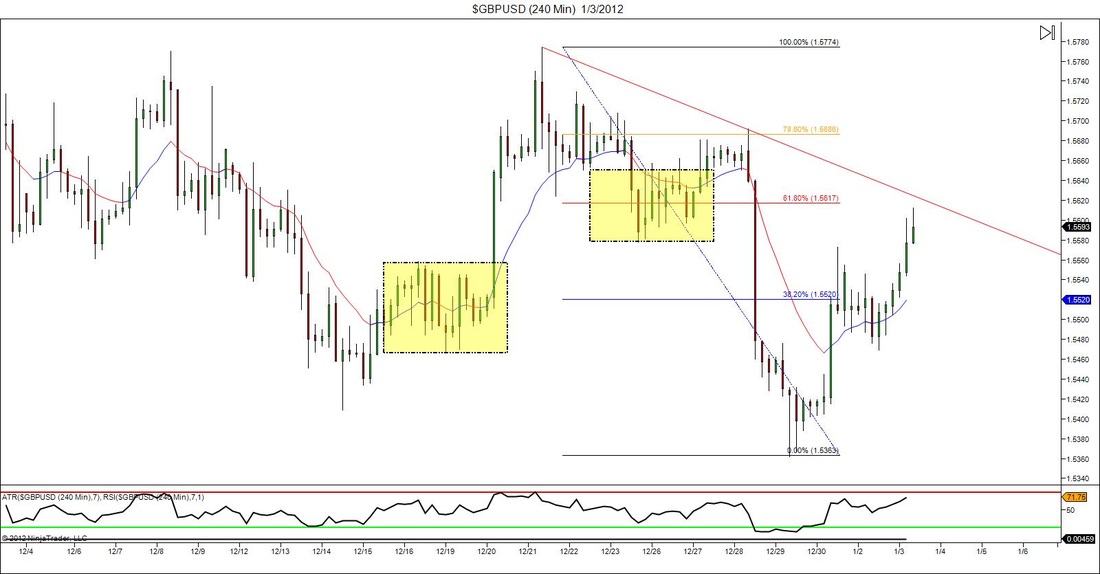
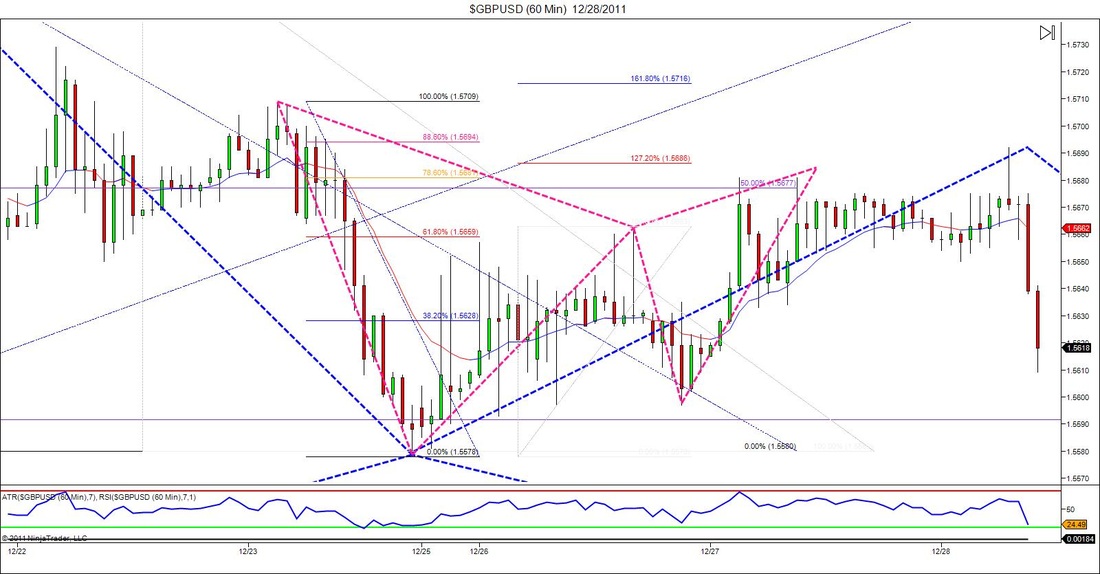
Both of these chart are from patterns that I saw on the GBPUSD. The chart above is from the 1hr chart and the below chart is of the 4hr. When doing some analysis yesterday I originally first noticed a pretty good potential bat pattern forming on the 4hr chart. However, since it was a ways away from completion I simply drew out my prediction and continued to zoom down a timeframe to look for any smaller moves. (I'm still not trading live until the new year, but I wanted to get back in the groove or routine of my analysis so I don't have any rust come Jan. 3rd.) When I went down to the hourly chart I saw a legit Gartley completion that had not quite hit my would be entry point which was a difference between the 78.6 retracement and the 127.2 extension. Price action actually bounced right off of the 50% retracement of the bigger Bat pattern which is why I liked this smaller pattern even more. When I checked back this morning I noticed that price came back and retested that area, and although the retest failed, the wick on the high candle would have gotten me filled on my Gartley entry. I didn't check the fibs on this thing yet but just from eyeing it up it looks like my 1st target would have been hit, which means stops would be moved to breakeven and all of the potential pain would have been erased. :-)
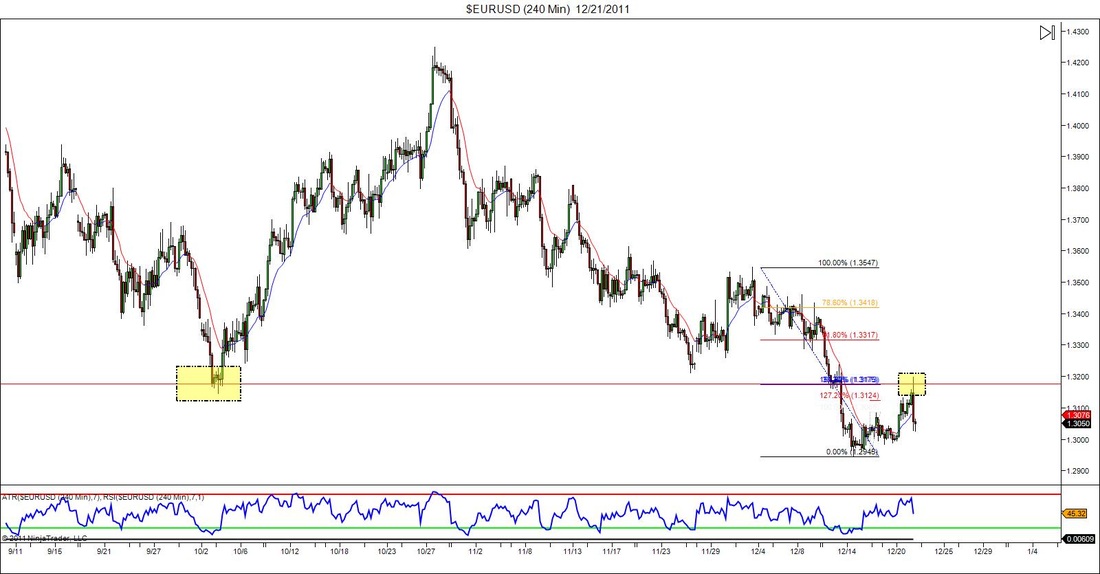
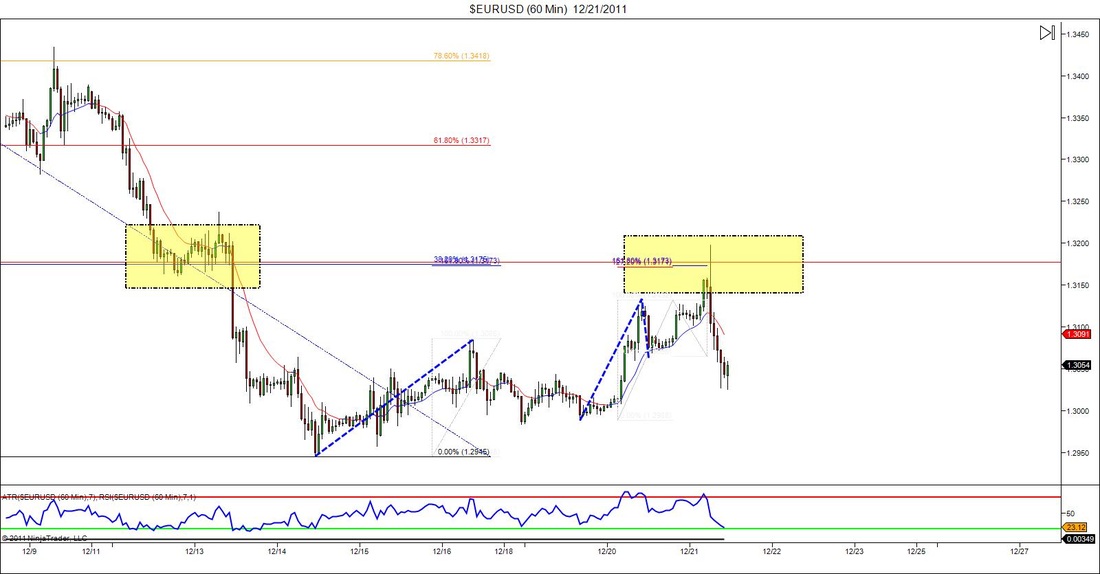
Below are three charts. The first two charts (starting from left to right) are of the EURUSD and a trade setup that I identified yesterday morning. Again, I'm done trading for the year, but I still like to get some practice and play with some ideas.
(CHART 1) In this case the market had broken down and made some new structure lows then started to retrace. Whenever I see this I was taught to always ask myself "where is the market most likely to retrace to?" If you look left I highlighted the place that I predicted the market to run into some resistance at. This same resistance level also happened to line up with a 38.3 retracement of the last major down move.
(CHART 2) If you look at the middle chart, I zoomed down to the 60min timeframe and threw in some Fib's to see if I would have any other reasons to get short at this point. At first I was looking for an ABCD pattern at the bottom, but it didn't extend long enough. However the 1.618 extension of that AB leg did line up exactly with the 38.2 retracement from earlier. Later I continued to throw in some more fib extensions and inversions as price action progressed and in each case there was something that line up at that 38.2 retracement. Not a bad opportunity if you entered on an aggressive order.
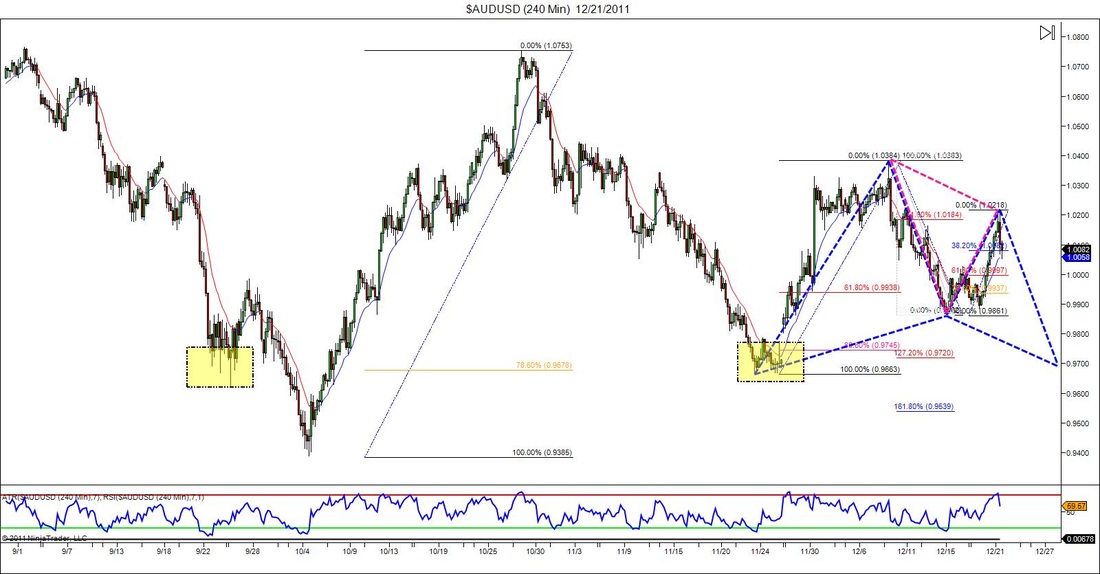
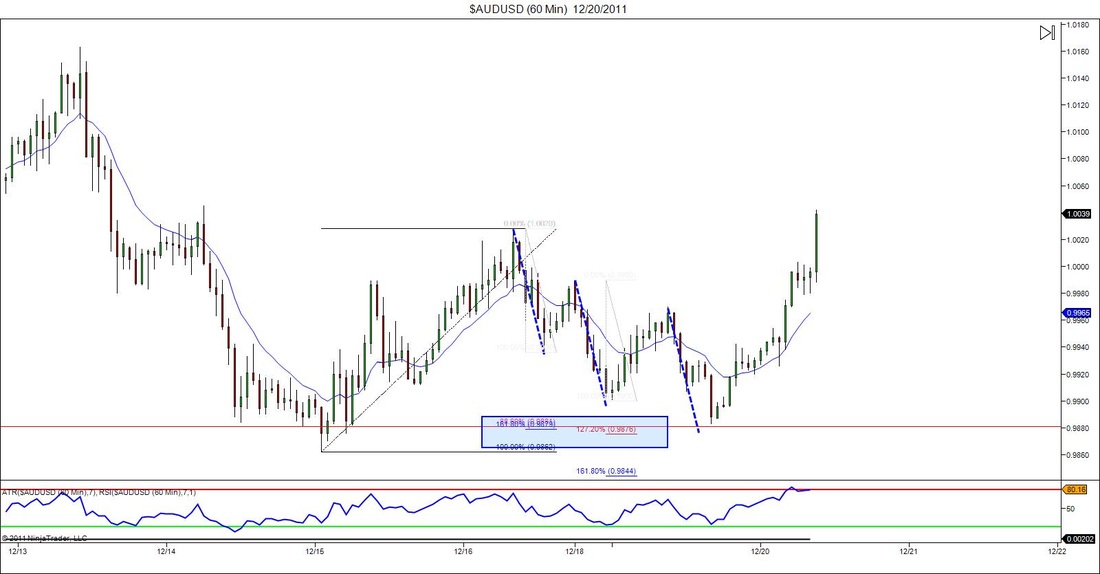
(CHART 3) The third chart is a potential Gartley setup on the AUDUSD. Nothing fancy about this setup but I put it on here because there can actually be a smaller gartley setting up in the opposite direction. I say could be because obviously we have no idea what's going to happen until price moves, but its something you should keep your eye on. If the bigger one does complete then, there should be a pretty good risk reward ratio on the trade since it will be pretty close to structure. Something to keep an eye on for the future.
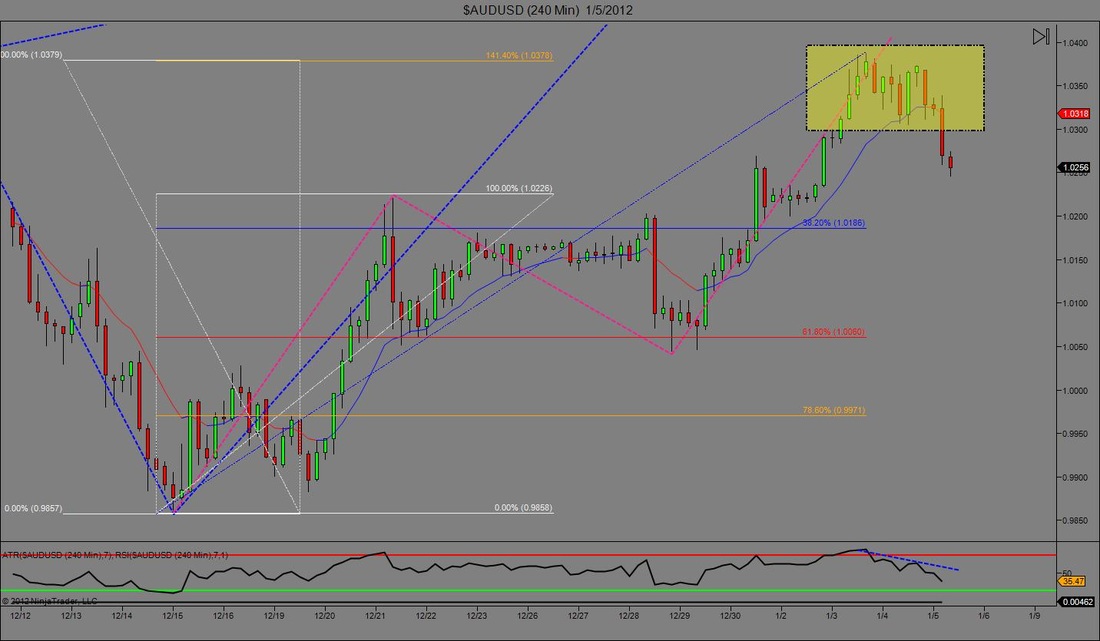
Last night a fellow trader named Andre sent me a few charts which demonstrated some pretty awesome harmonic moves in the market. One of those charts was the AUDUSD, so this morning I decided to bring it up on my computer and take a look at it. Andre noted a perfect 3 drives pattern as noted above but as i did some more analysis I also saw that the final drive ended at an area with some pretty good ratio confluence. And by pretty good I mean a 1.618 extension of A-B, a 1.272 extension of CD, and a 88.6 retracement of what would be XA. And as you can see price action reversed and skyrocketed off of that point. All I can say is Nice!


 RSS Feed