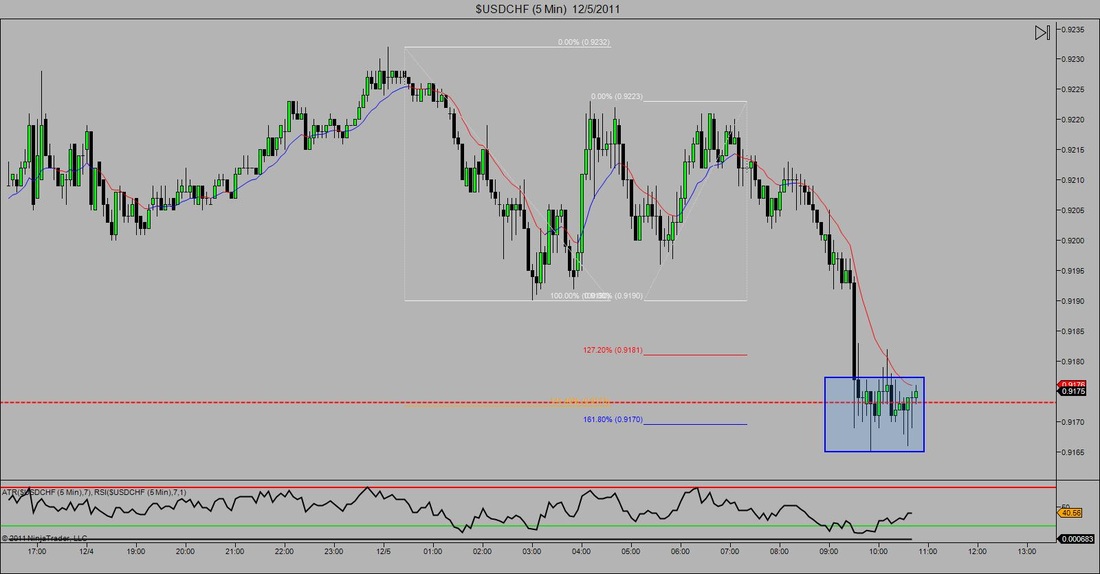
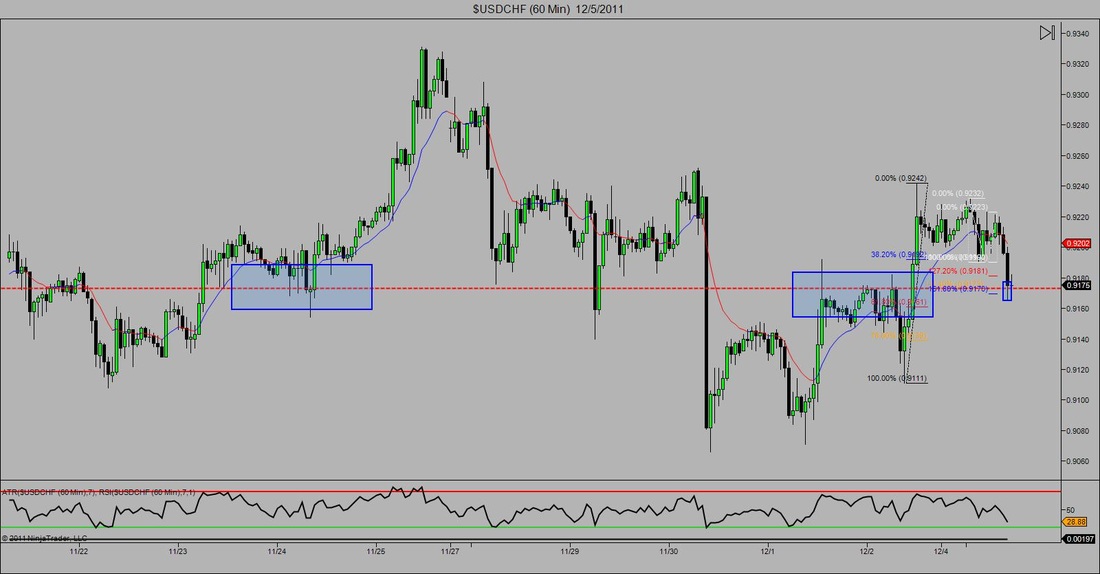
The charts below were taken from the USDCHF on the 5min and 60min charts. I wasn't closely watching the charts today because I don't day trade on Monday's but every time I glanced over at this pair I noticed that price action still had not broken that area. At one point it started to look pretty ugly which actually made me take a closer look. When I looked closer I saw that price action was struggling to break through that area of resistance and that the market was also over sold at a point. After the numerous retest of that oversold point there was also a good amount of RSI divergence happening. Next I decided to look left to see if there was and structure present and the answer was yes. Then just to be safe I zoomed out to a 1hr chart just to see if the structure on that chart agreed with what I saw on the 5min. The answer was yes. Lastly I through in a Fibonacci extension and inversion and what do you know, there was some ratio confluence as well. So what originally looked like a bunch of junk actually turned out to be a very good trade setup. Again, I don't day trade on Monday's so I didn't take it but it was some pretty good practice which is just as valuable in my eyes.
*Looking at the trade now, it just hit the 38.2 retracement which means I would have moved my stops to break even. So this now would have become a non-risk trade and mentally it doesn't get any better than that
*Looking at the trade now, it just hit the 38.2 retracement which means I would have moved my stops to break even. So this now would have become a non-risk trade and mentally it doesn't get any better than that


 RSS Feed