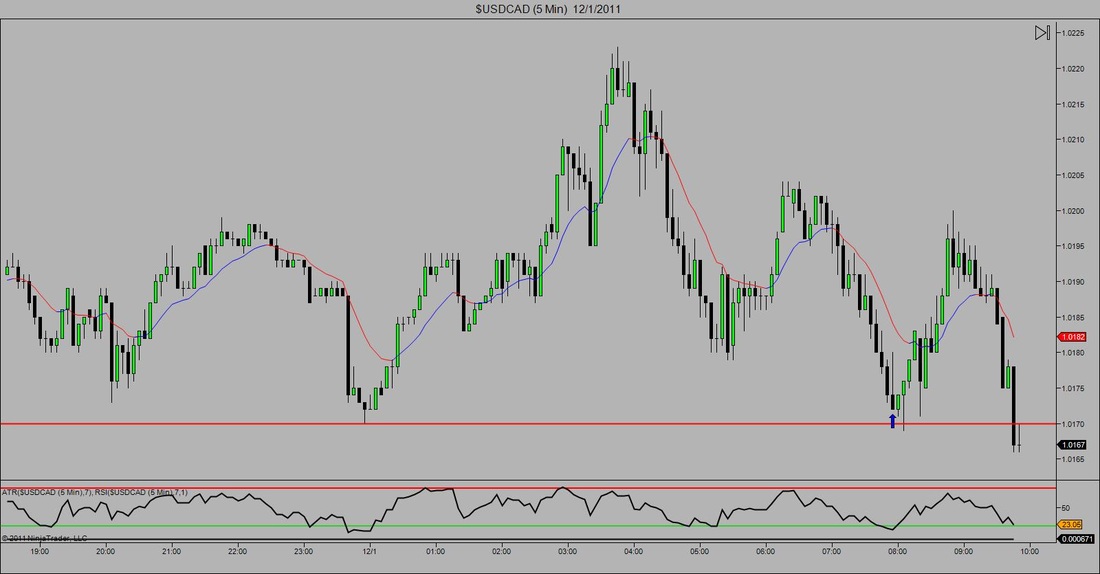
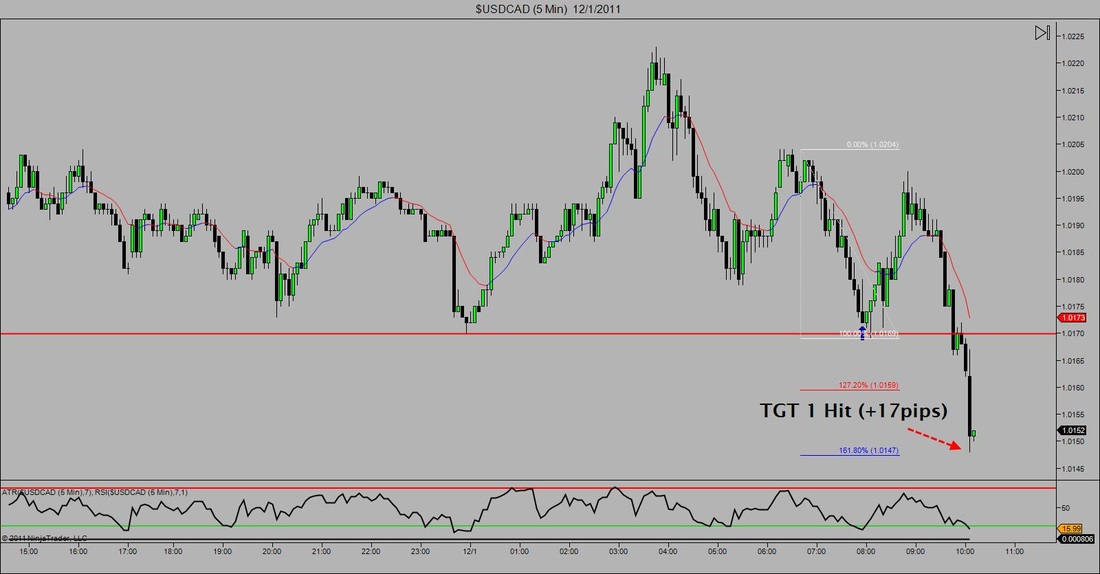
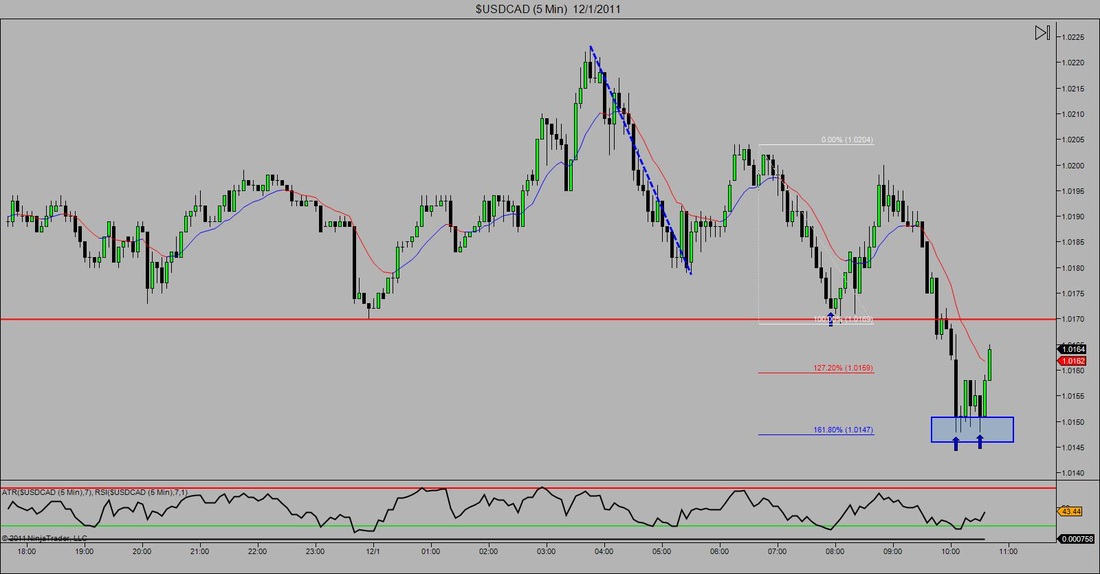
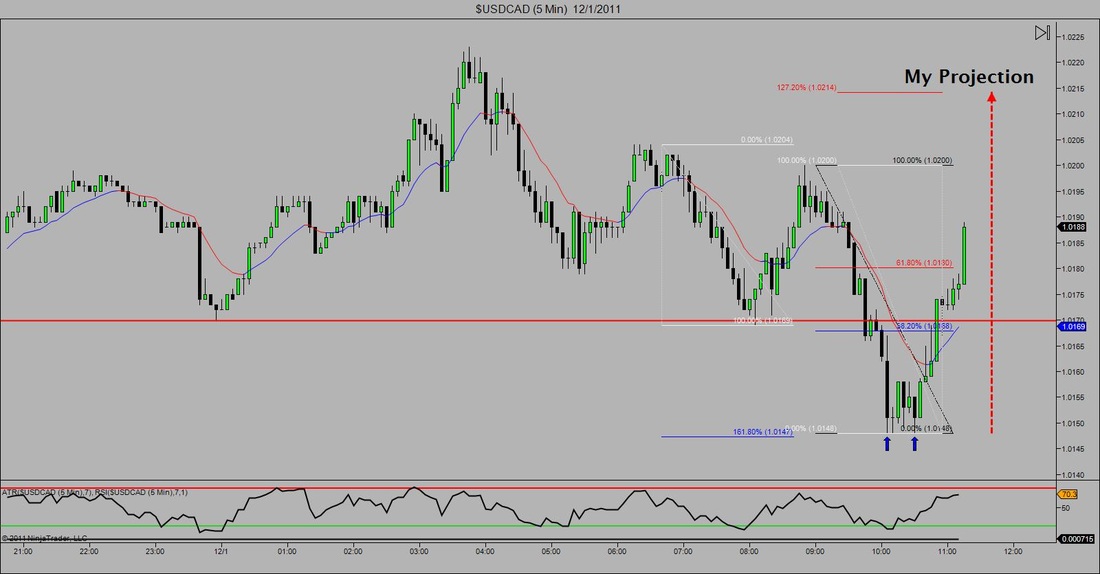
Below are 4 charts demonstrating 2 different trades that happened either simultaneously or back-to back on the same pair depending on how you trade things. I'll start with the first chart (upper left). In this chart the red line represents an area of good resistance along with some Fibonacci ratio agreement.. My counter-trend trading mindset tells me that there is a good chance that price action will stall once it reaches this level. In this particular case price action broke through and closed underneath this key structure point telling me that the market was likely to continue south. So I entered Short making my target a 1.618 Fibonacci extension. Price action then played around for a little while retesting what was now a support level before rolling over to the 1.618 (top right). After stalling at the Fib extension the market put in a perfect double bottom (Bottom left). This double bottom at the 1.618 extension offered the perfect chance to get into the market long as a countertrend trading opportunity. Long story short price action shot right back up. Now I didn't get involved in the 2nd move because I already had a position going short and was waiting to see if my 2nd target would be captured. By the time I was stopped out for break even, the market was too far gone for me to get involved but for an advanced trader you can easily see how both moves could have been taken advantage of.


 RSS Feed