
MOVING TARGETS
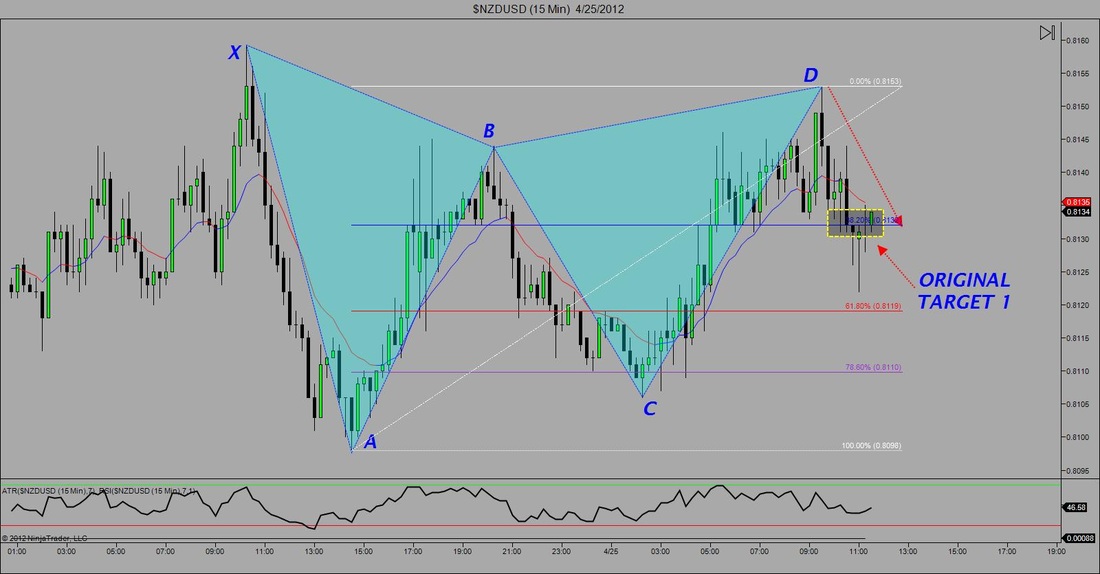
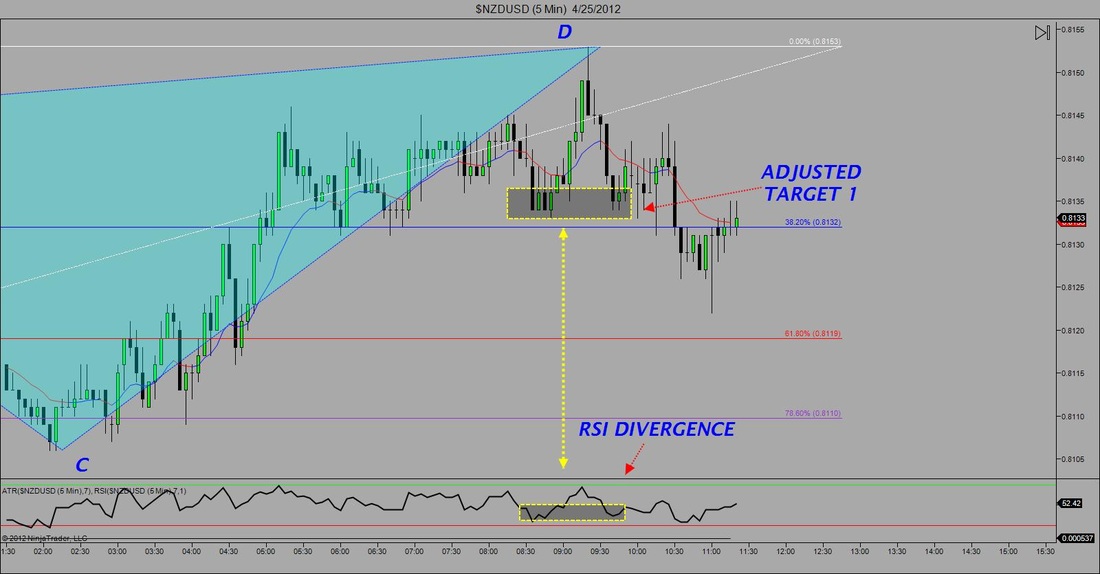
One of the WORST and most repeatable offence that a trader makes is moving targets. And by his I mean taking profits off too early instead of sticking to the original plan. I've done this plenty of times in the past and I'm sure that each and every trader reading this has done so as well. We finally get over this hump once we fully develop confidence in our own trading and get to the point where we honestly can care less about any one single trade. This is great, but the downfall is when we become so robotic and stubborn that we let our pride get in the way of our analysis. I personally have a few rules for when and how early I can take profits off simply so I'm not there watching the market tick by tick, but in the Live Room today we had a case where we had to adjust targets on a trade based on our analysis. The charts above show a trade that we took on the NZDUSD. As the market rolled over after the pattern completion, price action came within a single pip of my target. Watching the market move on the 15min chart I noticed that it kept banging on that level multiple times which lead me to take a closer look. When I looked at the 5min chart I noticed we were at what else but a previous structure level and that the market had RSI divergence telling us harmonic & ratio based traders that the market may be looking to turn around. Therefore we moved out targets up by 2 pips and eventually got filled. Needless to say the market eventually rolled over regardless, but it was a better safe than sorry type of play.
Anybody that has been through the Pro Trader Course know about the powers on Neurological Associative Conditioning. Just as how we're triggered to know that touching a hot stove top equals pain, most successful traders have been programmed to relate moving your targets to equaling bad. Today was a perfect example of how the markets aren't simple black and white. There are always room for adjustments in this profession, the key is doing it the correct way and not simply using it as an excuse.
A CLEARER VIEW
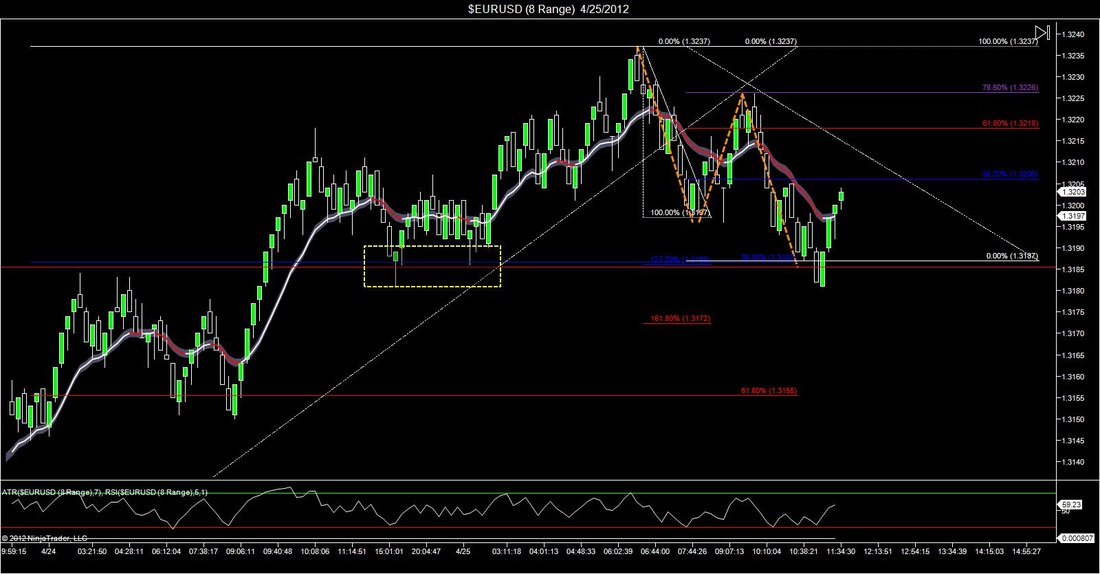
Here is a quick bonus post for you day traders out there. When we think lower time frames we often think 5 or 10 minute charts. I love these charts and have had great success trading them. However, as you probably know the often get a little clustered. Especially on days where the market seems to be in consolidation. So what do you do when you get a chart that is hard to read and analyze? Go to a different style of chart, mainly Tick or Range. Because these charts are not timed based, they often present a much clearer picture. The charts below are of the EURUSD taken at the exact same time. Although the basic formation of the two charts are similar it is obvious that the Range bar chart on the right is a lot clearer and easier to read than the 5 minute chart on the left. As a ratio trader, I often find it much easier to use extensions and retracements on the range bar chart as well. The only drawback I have is the fact that you never know when each bar will close since it's based on a range of movement rather than a time. This simple means that you have to be even more alert that usual, but it's more than worth it if you're able to.
One of the WORST and most repeatable offence that a trader makes is moving targets. And by his I mean taking profits off too early instead of sticking to the original plan. I've done this plenty of times in the past and I'm sure that each and every trader reading this has done so as well. We finally get over this hump once we fully develop confidence in our own trading and get to the point where we honestly can care less about any one single trade. This is great, but the downfall is when we become so robotic and stubborn that we let our pride get in the way of our analysis. I personally have a few rules for when and how early I can take profits off simply so I'm not there watching the market tick by tick, but in the Live Room today we had a case where we had to adjust targets on a trade based on our analysis. The charts above show a trade that we took on the NZDUSD. As the market rolled over after the pattern completion, price action came within a single pip of my target. Watching the market move on the 15min chart I noticed that it kept banging on that level multiple times which lead me to take a closer look. When I looked at the 5min chart I noticed we were at what else but a previous structure level and that the market had RSI divergence telling us harmonic & ratio based traders that the market may be looking to turn around. Therefore we moved out targets up by 2 pips and eventually got filled. Needless to say the market eventually rolled over regardless, but it was a better safe than sorry type of play.
Anybody that has been through the Pro Trader Course know about the powers on Neurological Associative Conditioning. Just as how we're triggered to know that touching a hot stove top equals pain, most successful traders have been programmed to relate moving your targets to equaling bad. Today was a perfect example of how the markets aren't simple black and white. There are always room for adjustments in this profession, the key is doing it the correct way and not simply using it as an excuse.
A CLEARER VIEW
Here is a quick bonus post for you day traders out there. When we think lower time frames we often think 5 or 10 minute charts. I love these charts and have had great success trading them. However, as you probably know the often get a little clustered. Especially on days where the market seems to be in consolidation. So what do you do when you get a chart that is hard to read and analyze? Go to a different style of chart, mainly Tick or Range. Because these charts are not timed based, they often present a much clearer picture. The charts below are of the EURUSD taken at the exact same time. Although the basic formation of the two charts are similar it is obvious that the Range bar chart on the right is a lot clearer and easier to read than the 5 minute chart on the left. As a ratio trader, I often find it much easier to use extensions and retracements on the range bar chart as well. The only drawback I have is the fact that you never know when each bar will close since it's based on a range of movement rather than a time. This simple means that you have to be even more alert that usual, but it's more than worth it if you're able to.


 RSS Feed