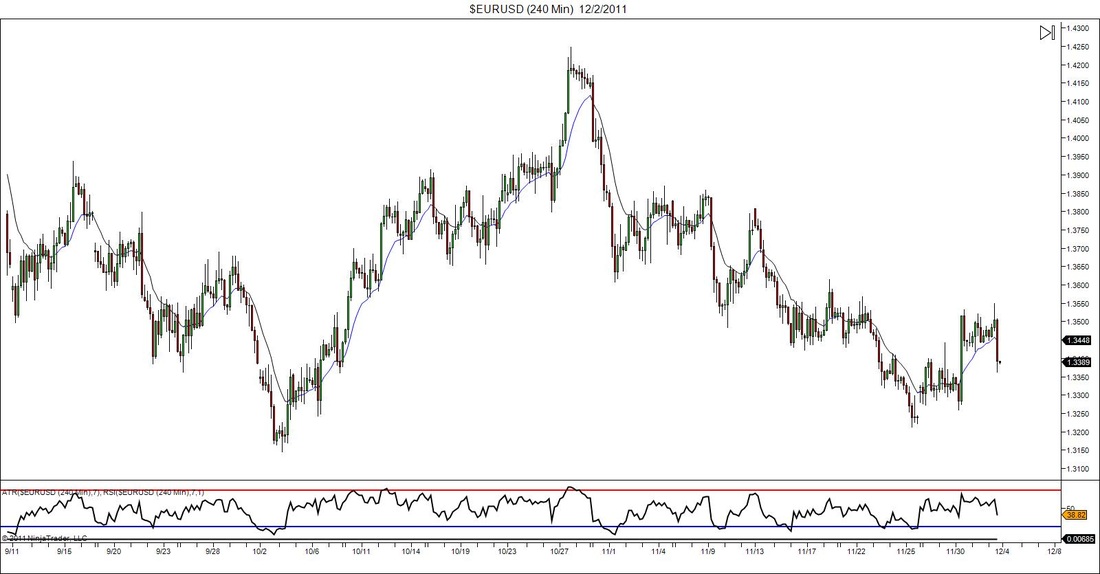
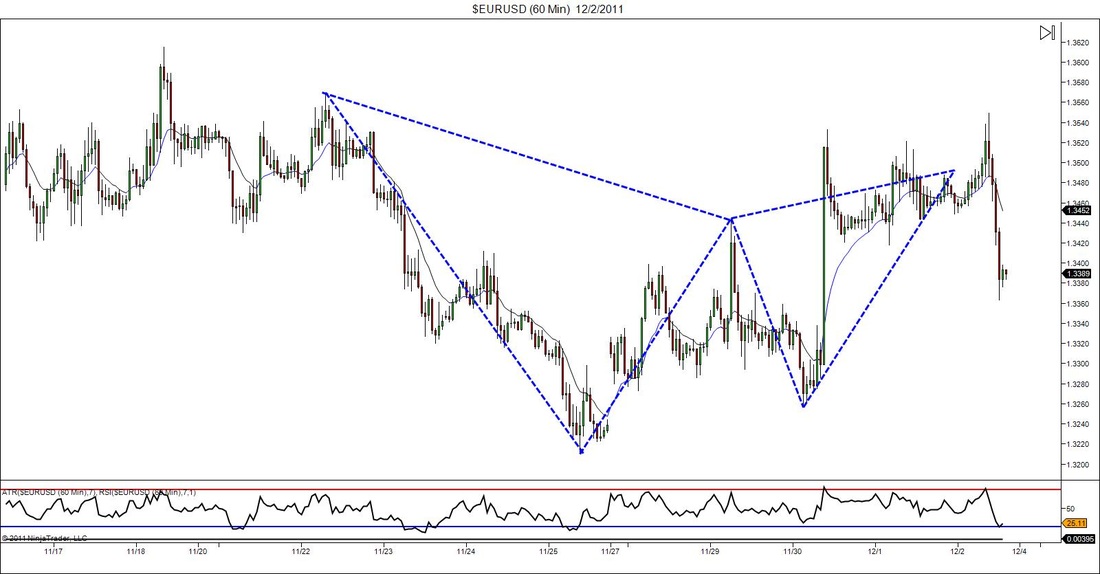
Take a look at the chart above for a second and let me know what you see..... Most people will respond nothing really.Experienced traders will either say a triple top high or an Abcd pattern. However if you look closely or at the chart below there is actually a beautiful Gartley pattern completion. Earlier today a good trader named Andre send me some charts of stuff he was looking at late last week. When looking at this charts I decided to open up mine simply to get some practice at see if I had similar notes marked off. When I opened up his chart on the EURUSD with a Gartley marked off I became confused because not only did I miss it, but it wasn't even on my radar. I didn't trade on Friday so I wasn't upset that I missed it, but when it comes to advanced patterns like such, we should be able to have them predicted hours if not days in advance. So why did I miss it? I missed it because on that particular pair I was only looking at the 4hr chart. The chart that Andre sent me was a 2hr chart and when I went down to the 1hr chart that pattern was even clearer.
When I do my market analysis I often only look at a pair on a single time frame only checking down to a lower on if I want a clearer picture of something that was previously identified. Seeing these charts, and noticing how my eyes didn't pick up this pattern at all shows me that maybe I don need to start looking at both time frames (4hr & 1hr) before going on to the next pair. My goal is to become a master trader and great technical analysis. Hopefully I took another positive step in that direction today.
Again thanks to Andre P. for bringing my attention to this.


 RSS Feed