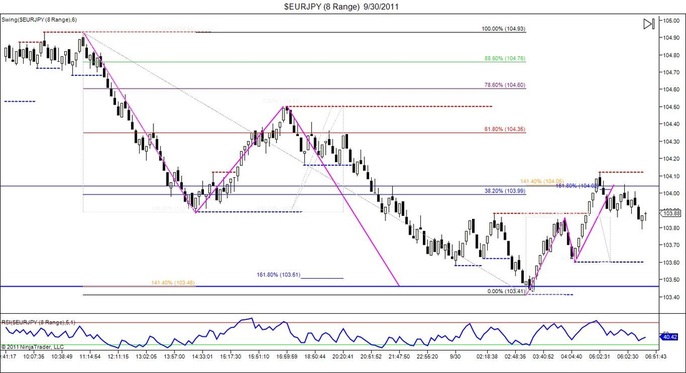
If you don't believe in the power of ratio's and market harmonics juts take a look at this chart. All of this happened before I was awake this morning, but if you follow the pink lines you'll see a larger AB=CD pattern completing at a 141.4 fib extension & 161.8 fib inversion zone, only to be followed by a smaller AB=CD pattern that completes at similar ratio confluence. Amazing how this stuff occurs. All that's needed is the skill to recognize it beforehand and the confidence to trade it. And a good set of rules of course.
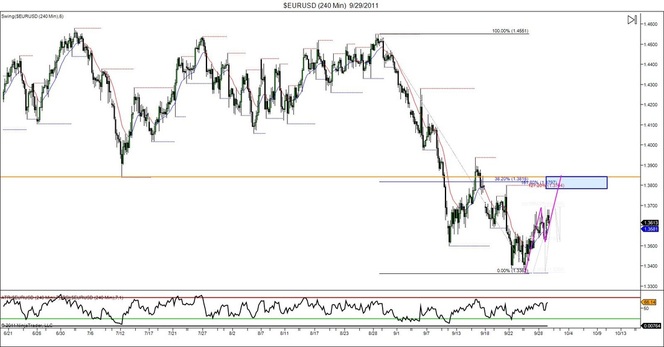
Not much on the table for me trade wise today. Got stopped out for small profits on the 2nd targets of 3 trades last night. So today it's time to refocus and analyze for the future once again. IF this AB=CD pattern completes (we never know of course) it should end at a point of major support (1.3840's) This could be a great place to start looking for reasons to get short if the opportunity presents itself.
Start blogging by creating a new post. You can edit or delete me by clicking under the comments. You can also customize your sidebar by dragging in elements from the top bar.


 RSS Feed