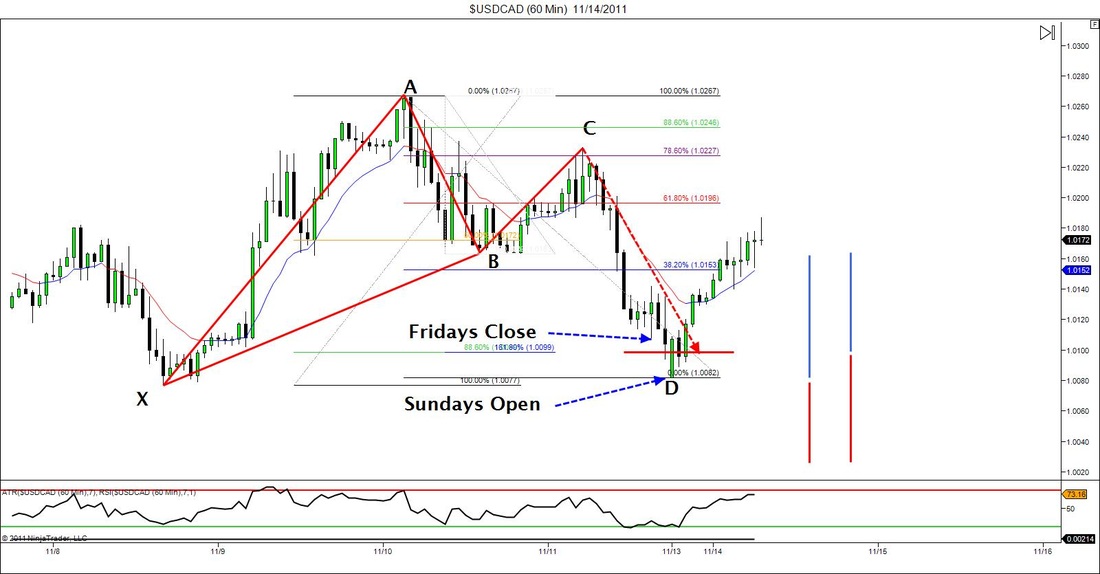
The other day I posted a chart of a Bat pattern on the USDCAD 5min chart. Well here is one on a little bigger timeframe. I didn't notice this pattern until I did my weekend analysis, but this pattern actually completed on Friday. However, because price action only moved about 5 pips above what my entry would have been, depending on how the market opened on Sunday, I knew I still might have chance to get involved. When I loaded up my charts on Sunday I noticed that the market formed a bearish gap of about 25pips or so which worked out perfect for me because it provided me with a reason to get involved. First of all, even though the market gaped downward, it still opened above the structure level at "X" which would give me the chance to lengthen my reward and minimize my risk on the trade. (This is shown by the 2 blue and red lines on the right side of the chart. Th e1st set is what my risk/reward ended up looking like and the 2nd set is what the original ratio would have been). Secondly, I know that when the market makes gaps, they usually get filled. Not all the time, but in the back of my head this gave be even more confidence that this trade would end up being a winner. And as you can see that's just what it did. Target 1 was hit sometime early this morning and now stops are breakeven.


 RSS Feed