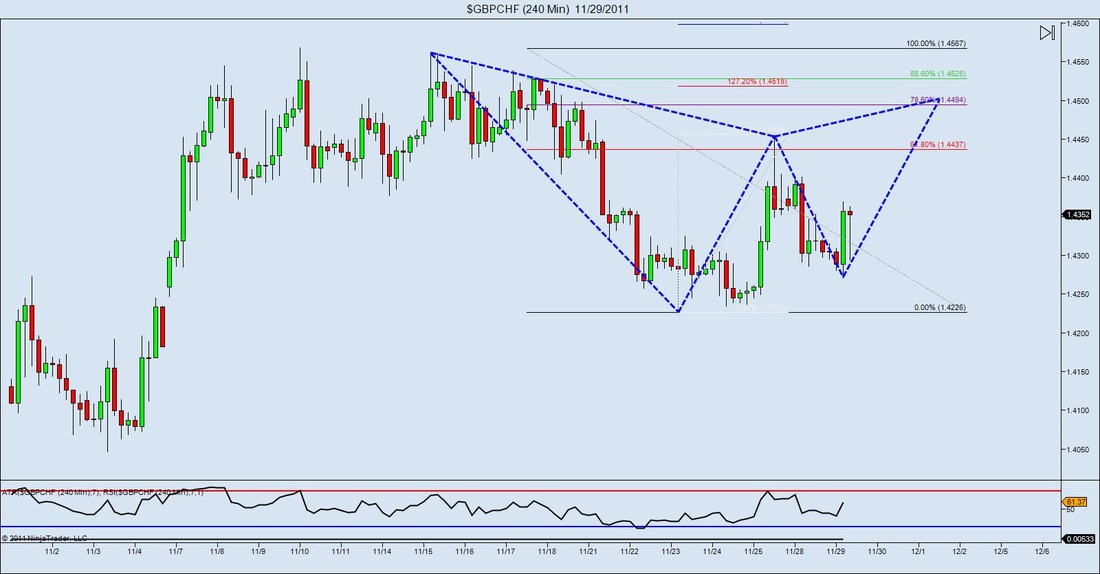
I usually don't like posting charts in advance because I don't want to be that person that provides signals and stuff, but I saw this earlier today I thought it could be a pretty good Gartley setup especially because it could complete near that previous structure area that put up a heck of a fight. We'll just have to way and see I suppose.
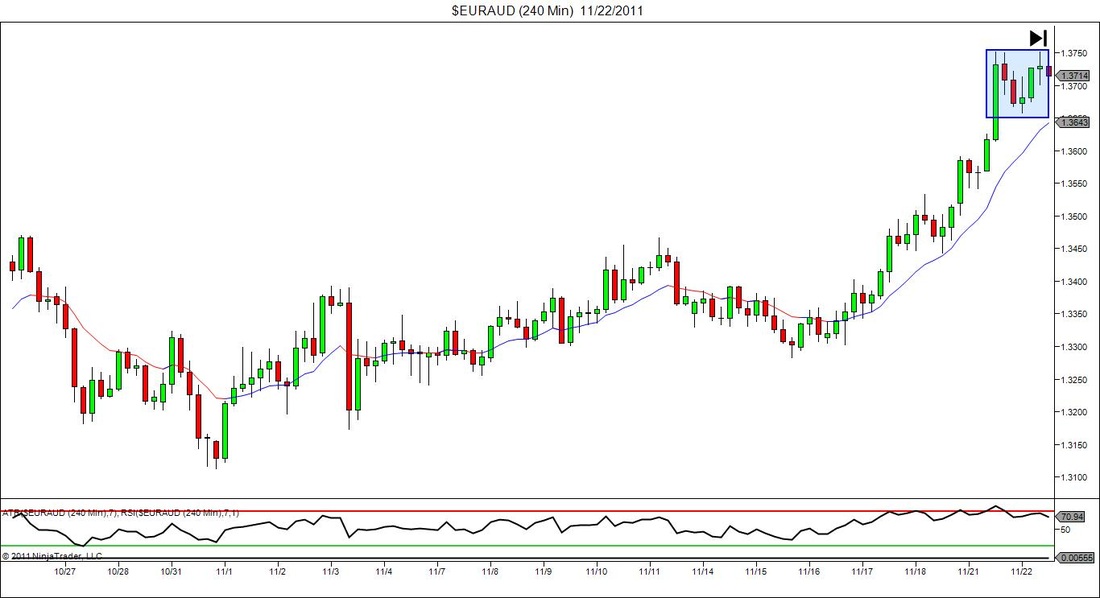
An interesting thing happened with a recent trade I took. The chart above was a chart of the EURAUD last week. If you've been keeping up with my post then you'll remember me saying that when identifying this trade opportunity I wasn't too excited about the setup. Regardless my rules said I had to enter so I went ahead and did it. Long story short this double top high with divergence (above) morphed into a head and shoulders top, before rolling over for target 1, then gapping over the weekend putting me close to target 2. I don't know what to call it, and honestly I don't care. I had a valid entry reason at the start and after that the rest is out of my hands. I don't mind calling it luck or anything else as long as it keeps filling the account up. But I just found it interesting to see once pattern morph into another in front of my eyes.
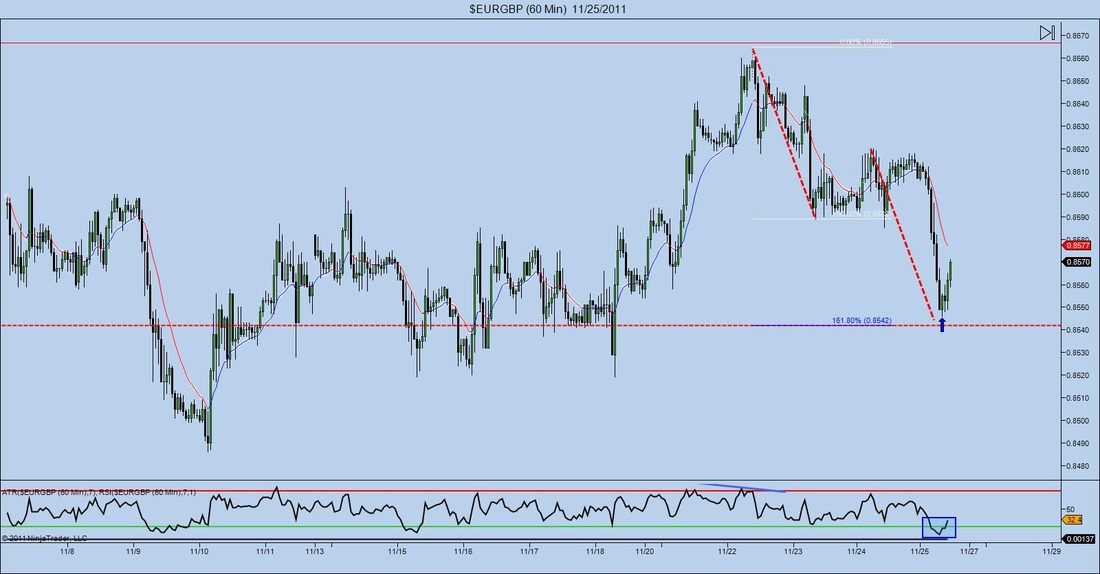
Here is a really good example of an ABCD pattern on the EURGBP 60min chart. I'm not trading today but I noticed it while looking at the progression of a trade that I wanted to take earlier this week. If you simply look at the chart you'll see and ABCD pattern complete at a 161.8 Fibonacci extension and well as being overbought on the RSI. The is some minor structure that you can see on the chart above, but if you actually bring it up for yourself and either zoom out or go to a higher time frame, you'll notice that there is some major structure points that are at this same level as well.
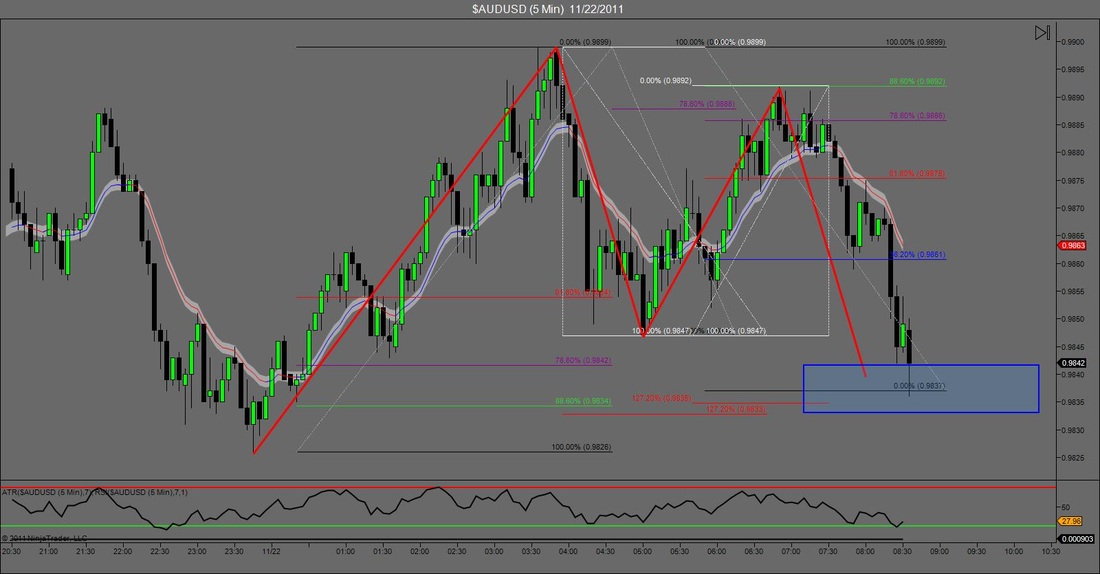
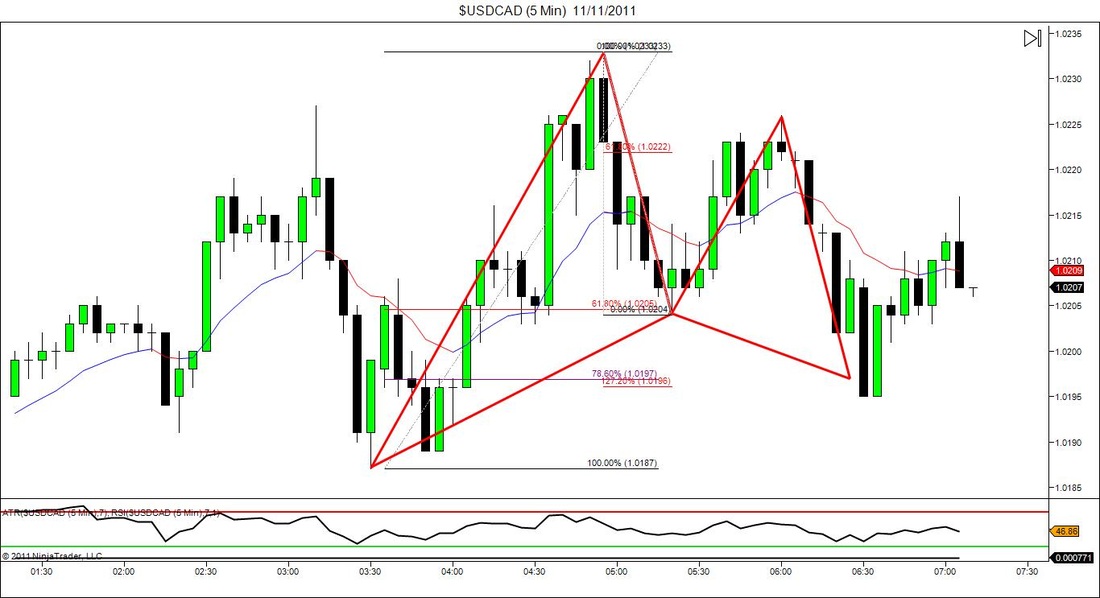
Got 2 charts for you guys to look at today. We'll start with the lower timeframe one. Above is the AUDUSD on the 5min chart and what we have is a Gartley Pattern. However because of the retracements the AB=CD completion and the ratio's don't line up with the best confluence. If you look closely the AB=CD lines up pretty good with the 78.6 retracement which is what we want to see. However the 1.272 extension line sup closer with the 88.6 retracement. So the question is where do you enter? Well there is a simple answer to that. In the voice of my trading mentor Jason Stapleton "what do your rules say?" In this case my rules tell me to enter at the location with the most confluence and if you look at the chart it should be pretty obvious where mine went. Luckily, I barely got filled with mine, placing them at the 88.6/1.272 area (+spread). Unfortunately, the trade ended up as a loser, but I was able to get involved at the area that presented me the least amount of risk.
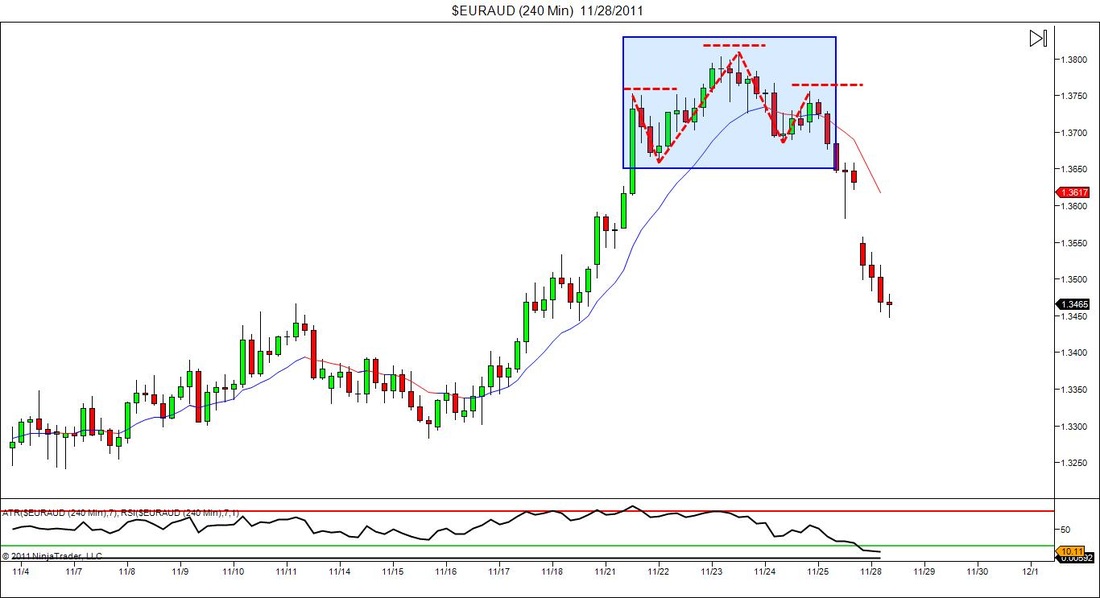
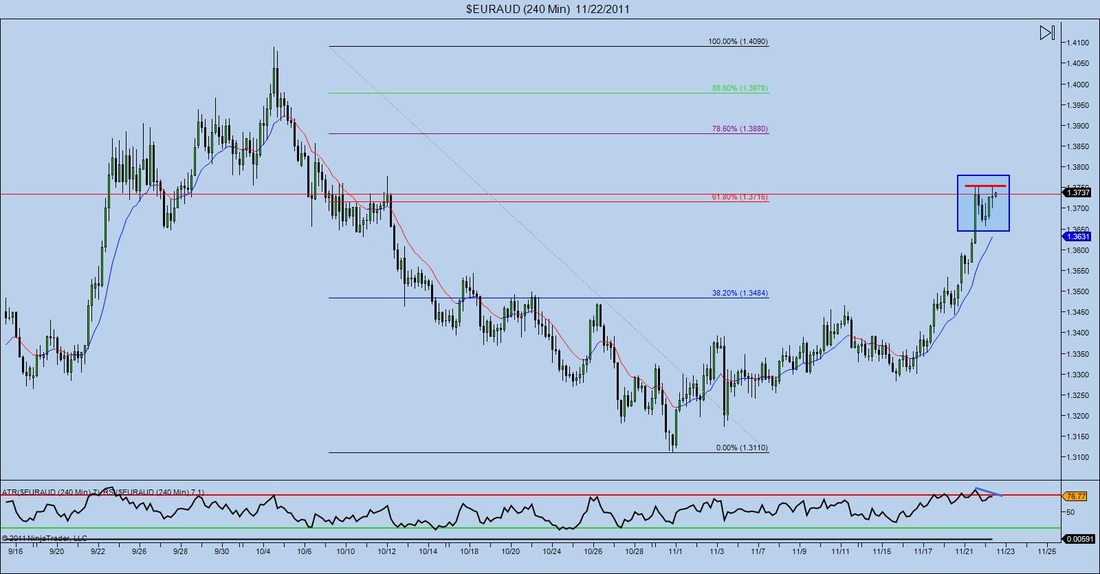
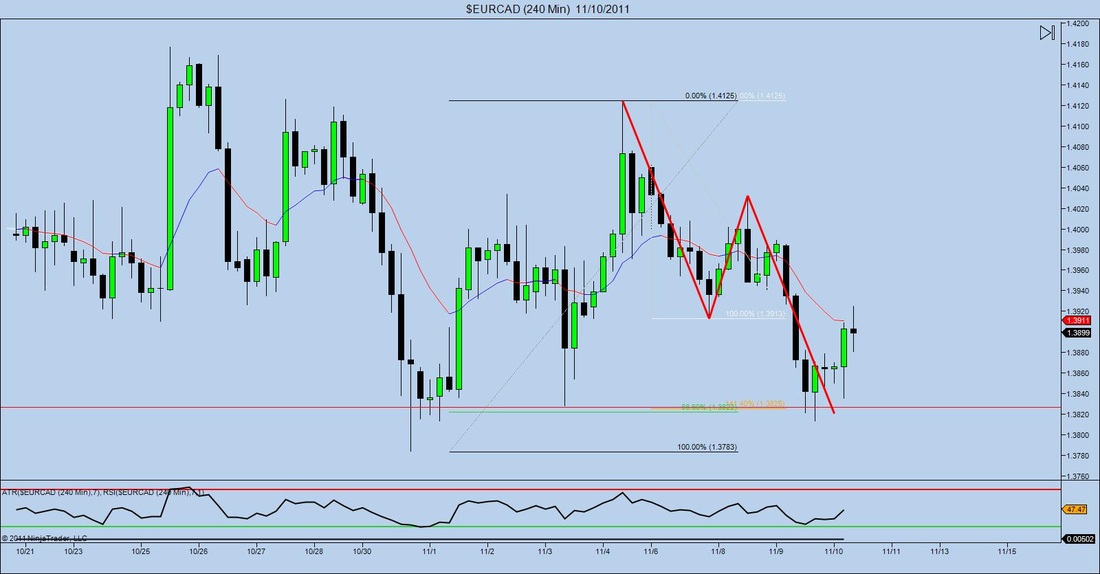
The chart below is the EURAUD on a 240 min chart. It may be hard to see, but a nice double top has formed, presenting the opportunity to get short. However, this trade is a lot more risky than the one above because there is not much more to it. The only ratio we have around it is the 61.8 retracement from the last bearish move. But there are no Fibonacci extensions that line up with it, nor is there any major structure or an AB=CD pattern. So depending on how aggressive of a trader you are, this may or may not be a good opportunity. On the bright side we have a double top (as mentioned earlier) along with the RSI being overbought with divergence on the rest-test. So is this a valid entry? Well you tell me.
So the coolest thing happened today. I was attending a free webinar hosted by a great trader named Todd Brown from Triple Threat Trading. In this webinar he brought up a chart from a former client and told me that I might be interested in looking at it since I am a ration based trader as well. When looking at the chart I noticed that it looked familiar and when looking back at my screen I noticed that I indeed was already involved in the exact same trade and the exact same point, and had already hit profit as well. I personally never try to base my trades off others analyses but it was pretty cool to see that three traders could see exactly the same thing on two different time frames, have the same entry and snag the same profits. Anyway let's take a look at the actual trade.
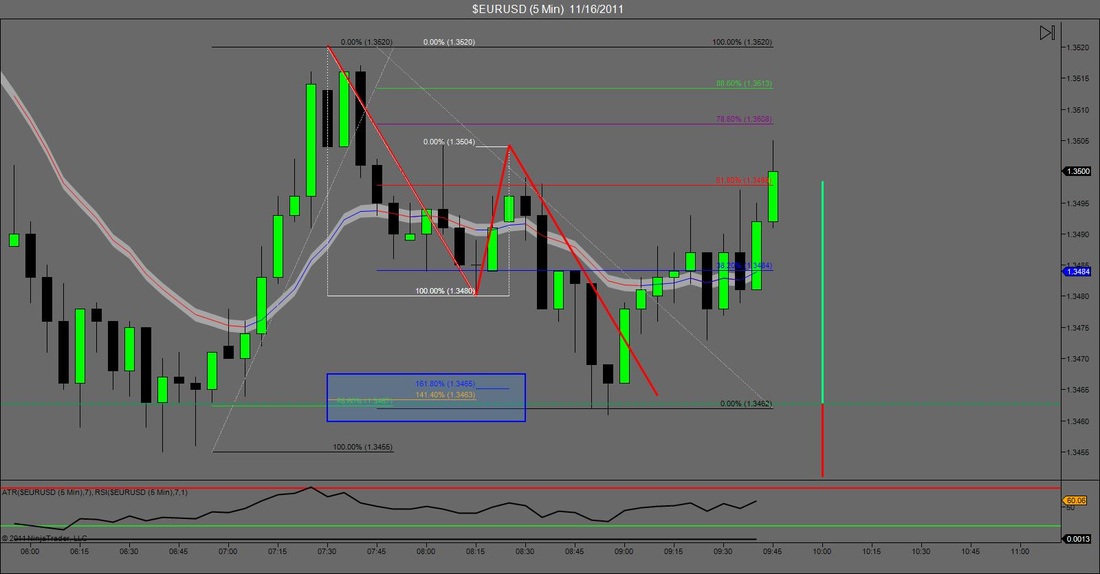
On the EURUSD 15min I was originally looking for an advanced pattern such as a gartley or a bat. However the market retraced too far to give me a valid signal by my rules. So I decided to zoom down to the 5 min chart and as always started drawing AB=CD patterns. I noticed that if it was going to complete it would stop right at the previous retracement which I deemed as structure. I then drew in some fibonacci extensions, inversions and a retracement from the original move and as you can see they all lined up at the same area. Needless to say I got involved. The rest speaks for itself.
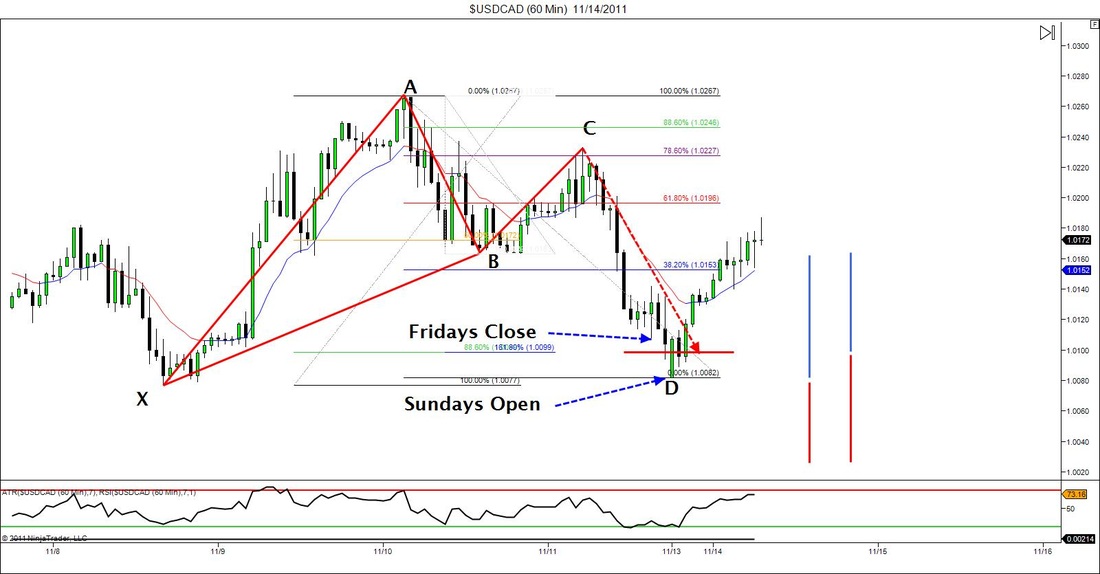
The other day I posted a chart of a Bat pattern on the USDCAD 5min chart. Well here is one on a little bigger timeframe. I didn't notice this pattern until I did my weekend analysis, but this pattern actually completed on Friday. However, because price action only moved about 5 pips above what my entry would have been, depending on how the market opened on Sunday, I knew I still might have chance to get involved. When I loaded up my charts on Sunday I noticed that the market formed a bearish gap of about 25pips or so which worked out perfect for me because it provided me with a reason to get involved. First of all, even though the market gaped downward, it still opened above the structure level at "X" which would give me the chance to lengthen my reward and minimize my risk on the trade. (This is shown by the 2 blue and red lines on the right side of the chart. Th e1st set is what my risk/reward ended up looking like and the 2nd set is what the original ratio would have been). Secondly, I know that when the market makes gaps, they usually get filled. Not all the time, but in the back of my head this gave be even more confidence that this trade would end up being a winner. And as you can see that's just what it did. Target 1 was hit sometime early this morning and now stops are breakeven.
Here is an example of a perfect Gartley on the USDCAD. If you look closely it hits 61.8, then 61.8 again then extends to 78.6 and 1.272 at the CD completion point. Simple Right? (Sorry if I went fast i'm trying to rush so i can get back to day-trading). I saw this early this morning when I opened up my 5min portfolio. I was about a half hour behind so I didn't catch it but I wanted to use it as an example to show how the same patterns form on all different time frames...Just a little faster that;s all. If you read my post from yesterday "A New Perspective" then your aware that I have recently made the change to doing some day trading on the five minute charts. Although this is the case there is no real difference between this and trading on the 240min like I'm used to. It's just that everything is happening with the fast forward button pushed. For me that just means I have to be a little more focused.
I have noticed a massive amount of ABCD patterns forming this week in the market on many different time frames. I through this chart on because it serves as a really good example since it completes at structure and some Fibonacci ratios as well which makes it an even better opportunity. Also if you look to the left of my red marks in the bullish direction there is another ABCD completion which I believe I had marked off as a part of a advanced pattern. These things are everywhere, the hard part is finding them before they complete and having the courage to follow your rule sand get involved.
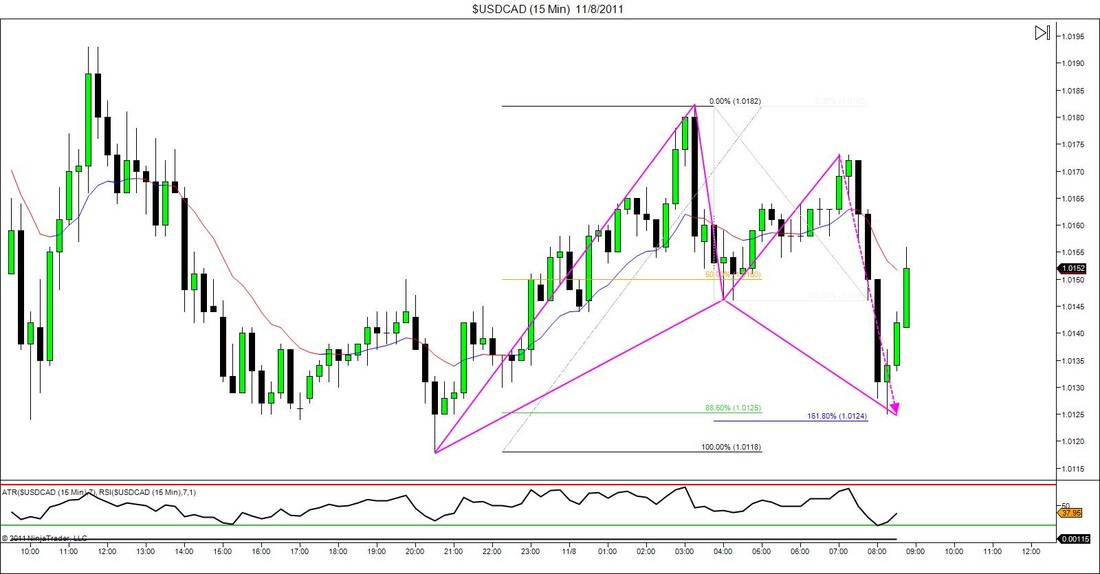
The market hasn't been doing much this week. Because of this I have decided to get away from my usual 240min charts and start taking a look at the 60 & 15min charts. I figured it would be a good training opportunity to start identifying valid trade setups on a faster time frame because that would make seeing things on my normal trading time frame that much easier. Here is an example of a recent Bat Pattern that formed this morning on the USDCAD.
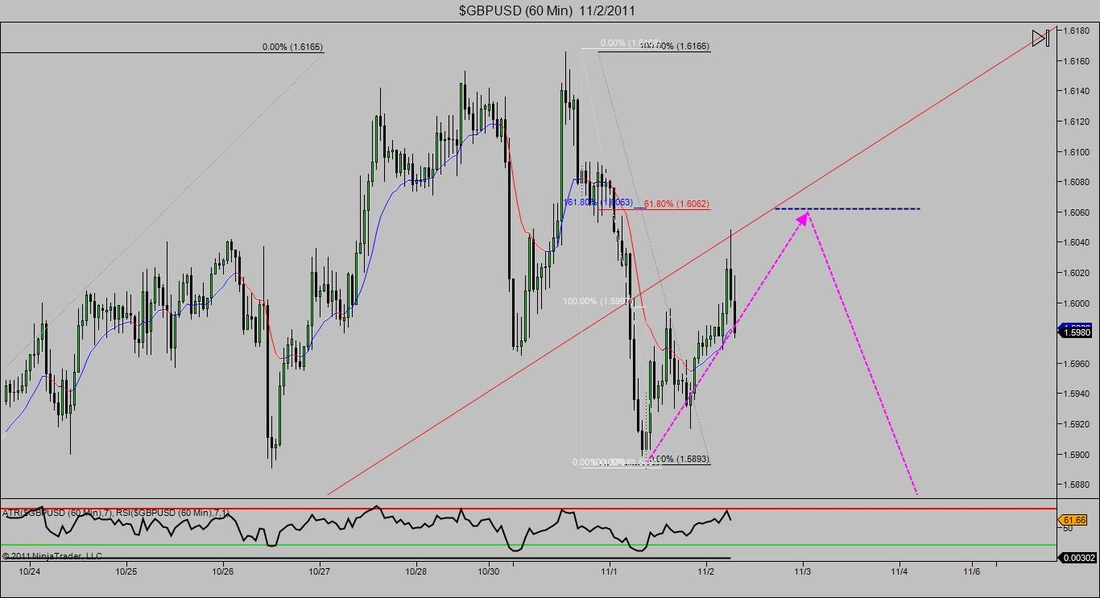
If you were able to take a look at the post I put up last night then you'll see that this pair reacted exactly how I thought it would. (If only pairs did this more often). However, although price action came up and kissed the trend line before reversing my entry orders were about 10pips above that point. Am I upset that I was able to predict something but not get involved? Yeah a little bit, but at the end of the day i know that I placed my orders at what I felt was the best entry point and because of that I have no regrets. If you look at this chart you'll notice one thing different from last nights. That one thing is a Fibonacci extension, and the 1.618 lines up exactly with the 61.8 which I originally had on there. that gave me even more confidence that this would be a prime point for the market to turn around. As my rules say I put my entry 5pips below that mark at 1.6057. Too bad price only came to 1.648. So that stinks but its good for the confidence to predict something and have it play out. And having confidence may be the biggest thing in this profession.


 RSS Feed