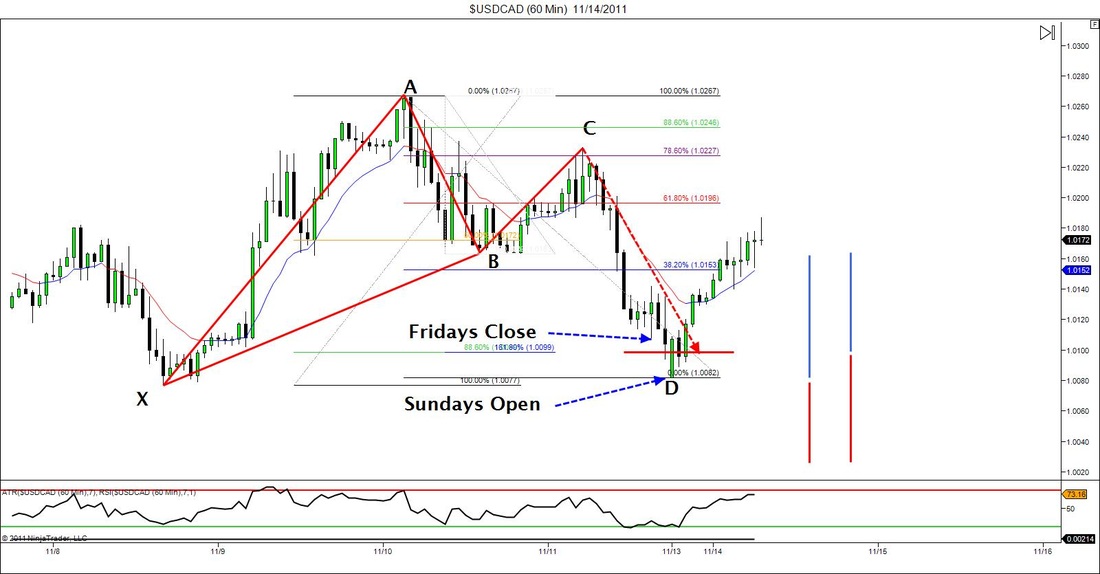
The other day I posted a chart of a Bat pattern on the USDCAD 5min chart. Well here is one on a little bigger timeframe. I didn't notice this pattern until I did my weekend analysis, but this pattern actually completed on Friday. However, because price action only moved about 5 pips above what my entry would have been, depending on how the market opened on Sunday, I knew I still might have chance to get involved. When I loaded up my charts on Sunday I noticed that the market formed a bearish gap of about 25pips or so which worked out perfect for me because it provided me with a reason to get involved. First of all, even though the market gaped downward, it still opened above the structure level at "X" which would give me the chance to lengthen my reward and minimize my risk on the trade. (This is shown by the 2 blue and red lines on the right side of the chart. Th e1st set is what my risk/reward ended up looking like and the 2nd set is what the original ratio would have been). Secondly, I know that when the market makes gaps, they usually get filled. Not all the time, but in the back of my head this gave be even more confidence that this trade would end up being a winner. And as you can see that's just what it did. Target 1 was hit sometime early this morning and now stops are breakeven.
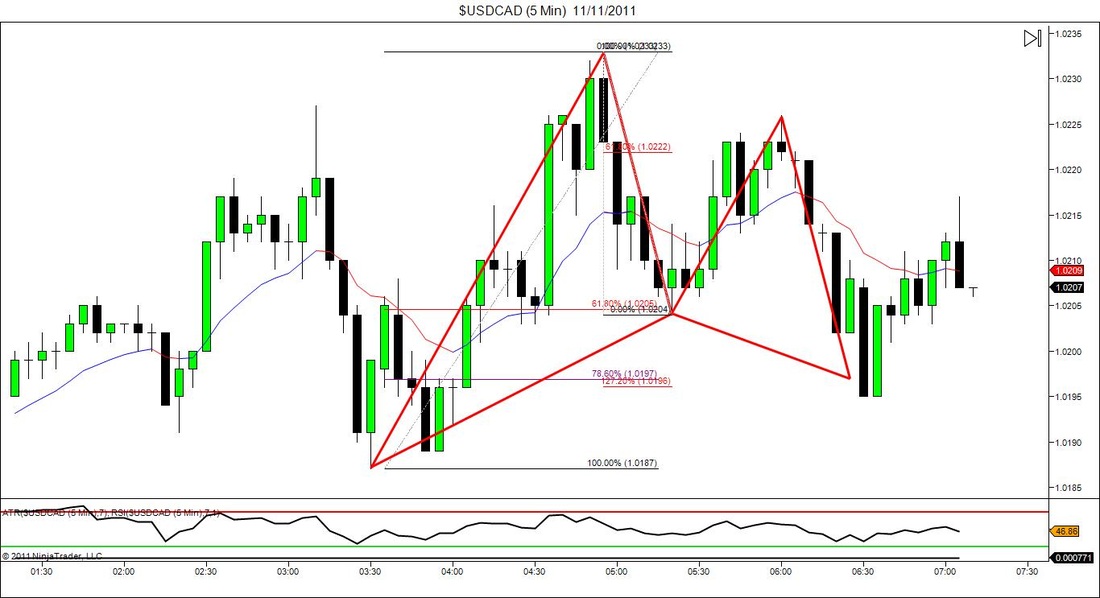
Here is an example of a perfect Gartley on the USDCAD. If you look closely it hits 61.8, then 61.8 again then extends to 78.6 and 1.272 at the CD completion point. Simple Right? (Sorry if I went fast i'm trying to rush so i can get back to day-trading). I saw this early this morning when I opened up my 5min portfolio. I was about a half hour behind so I didn't catch it but I wanted to use it as an example to show how the same patterns form on all different time frames...Just a little faster that;s all. If you read my post from yesterday "A New Perspective" then your aware that I have recently made the change to doing some day trading on the five minute charts. Although this is the case there is no real difference between this and trading on the 240min like I'm used to. It's just that everything is happening with the fast forward button pushed. For me that just means I have to be a little more focused.
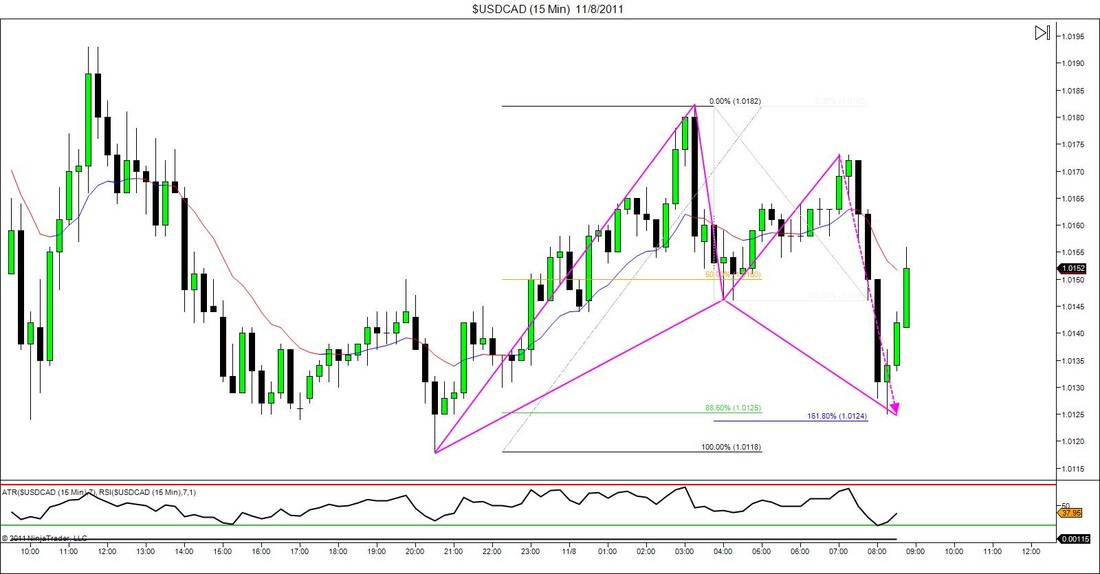
The market hasn't been doing much this week. Because of this I have decided to get away from my usual 240min charts and start taking a look at the 60 & 15min charts. I figured it would be a good training opportunity to start identifying valid trade setups on a faster time frame because that would make seeing things on my normal trading time frame that much easier. Here is an example of a recent Bat Pattern that formed this morning on the USDCAD.
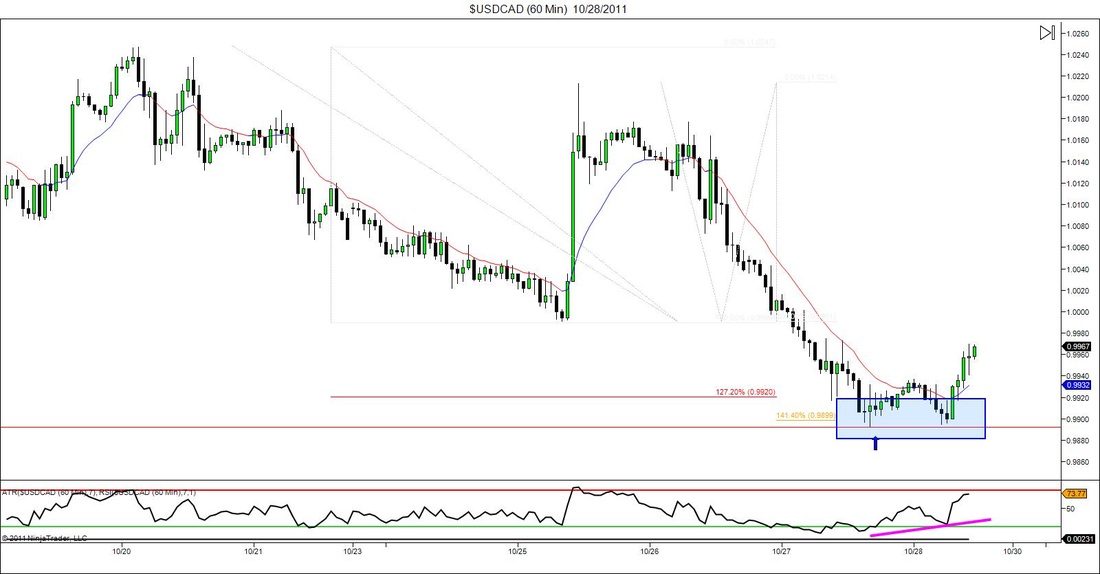
Nothing fancy about this chart just a simple double bottom on USDCAD. I noticed this last night when the market originally went overbought but my rules didn't allow me to place an aggressive order since there really isn't much major structure nor Fibonacci confluence. Therefore I was going to watch it closely for a retest with some RSI Divergence and see if I would get a chance to enter. If you read what I put under the "Morning Thoughts" section on the homepage then you'll see what kind of issues I had this morning, but long story short, price action had already moved to far for me to get involved at a price of my liking. Either way it still proves to be a good trading example and if I remember correctly there are some other ones setting up on a few other pairs on some longer term charts.


 RSS Feed