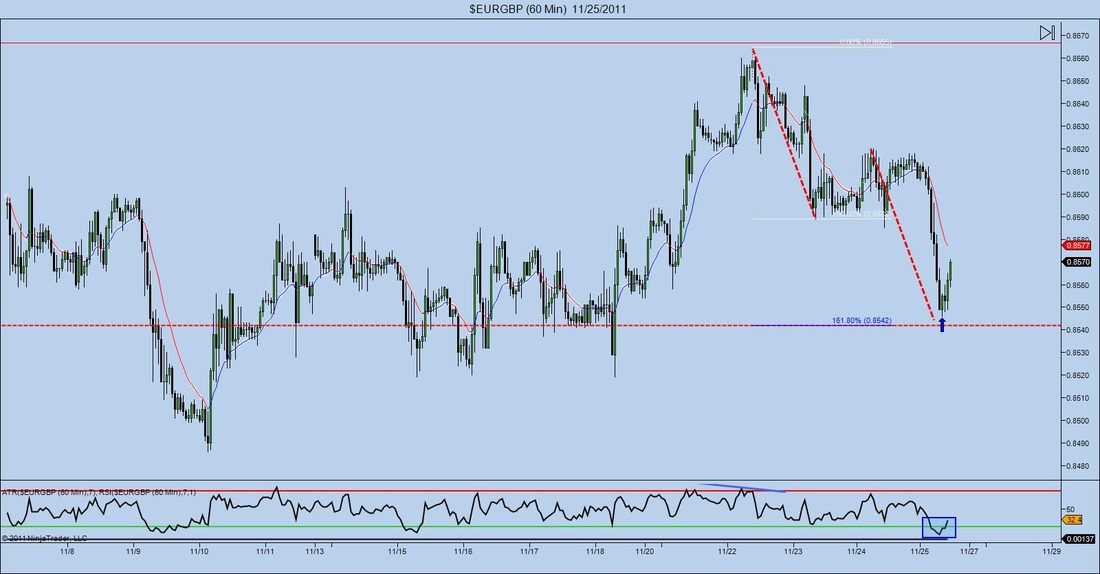
Here is a really good example of an ABCD pattern on the EURGBP 60min chart. I'm not trading today but I noticed it while looking at the progression of a trade that I wanted to take earlier this week. If you simply look at the chart you'll see and ABCD pattern complete at a 161.8 Fibonacci extension and well as being overbought on the RSI. The is some minor structure that you can see on the chart above, but if you actually bring it up for yourself and either zoom out or go to a higher time frame, you'll notice that there is some major structure points that are at this same level as well.
0 Comments
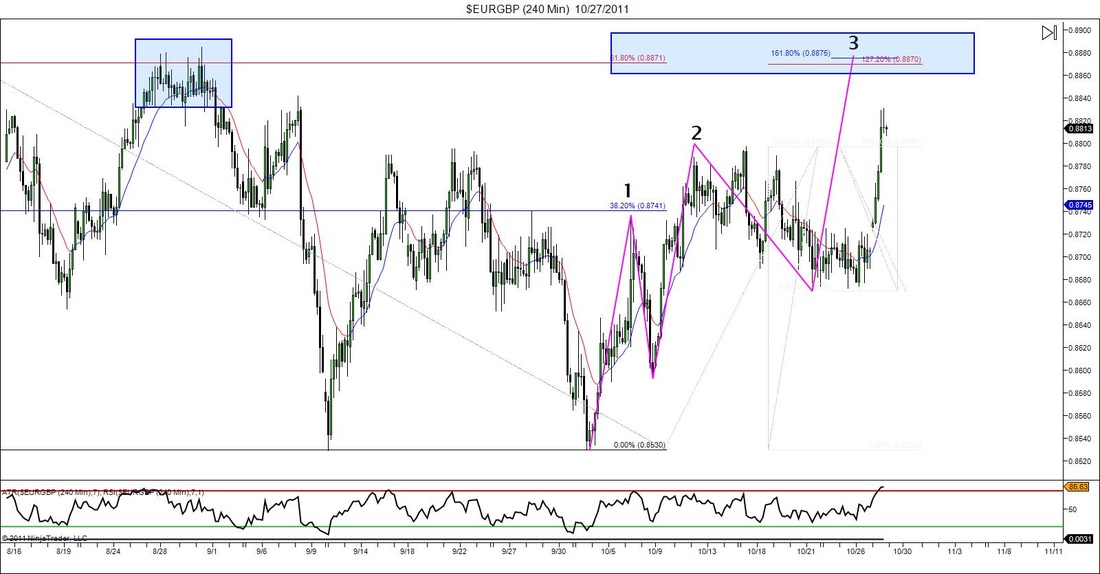
Another post so soon? YES! This setup looks even better than the last one I just posted. On the EURGBP pair there is a potential 3 Drives pattern that will complete at Fibonacci confluence and some structure if you look left. The Fibs I have marked are the 1.272 of the original ABCD move and the 1.618 is an inversion of the retracement that comes after the original ABCD. There is also a 0.618 retracement that comes from a bigger overall move. I just measures it for giggles and it winds up lining up right with the other two hmmmm. Add that to a possible equal move of AB and CD and I've got enough reasons to get in aggressively. Of course you should use your own rules and not follow me. Just something that seems as if it could be good.
|






 RSS Feed