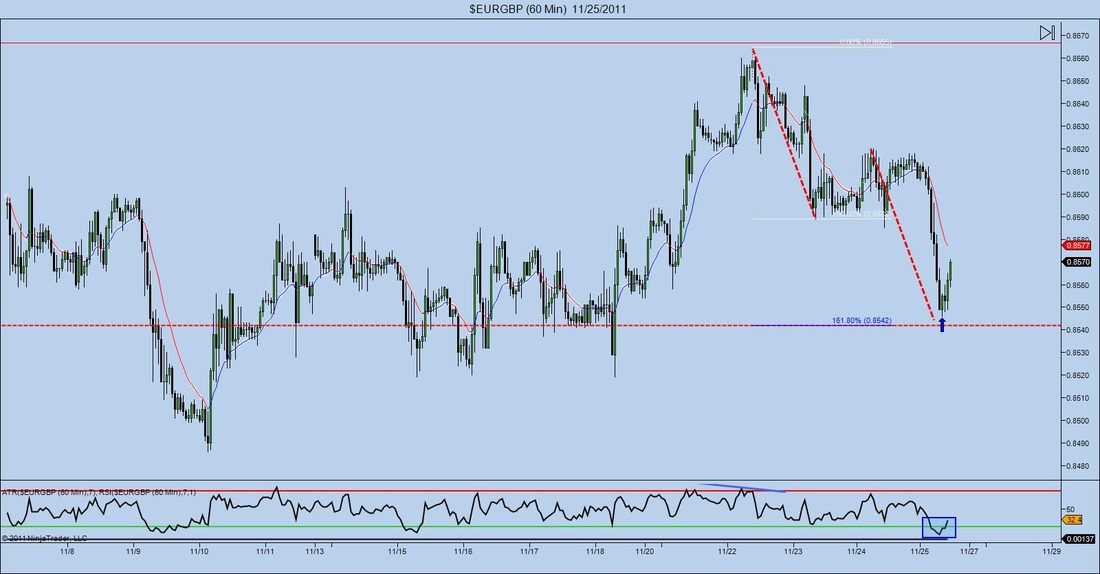
Here is a really good example of an ABCD pattern on the EURGBP 60min chart. I'm not trading today but I noticed it while looking at the progression of a trade that I wanted to take earlier this week. If you simply look at the chart you'll see and ABCD pattern complete at a 161.8 Fibonacci extension and well as being overbought on the RSI. The is some minor structure that you can see on the chart above, but if you actually bring it up for yourself and either zoom out or go to a higher time frame, you'll notice that there is some major structure points that are at this same level as well.
So the coolest thing happened today. I was attending a free webinar hosted by a great trader named Todd Brown from Triple Threat Trading. In this webinar he brought up a chart from a former client and told me that I might be interested in looking at it since I am a ration based trader as well. When looking at the chart I noticed that it looked familiar and when looking back at my screen I noticed that I indeed was already involved in the exact same trade and the exact same point, and had already hit profit as well. I personally never try to base my trades off others analyses but it was pretty cool to see that three traders could see exactly the same thing on two different time frames, have the same entry and snag the same profits. Anyway let's take a look at the actual trade.
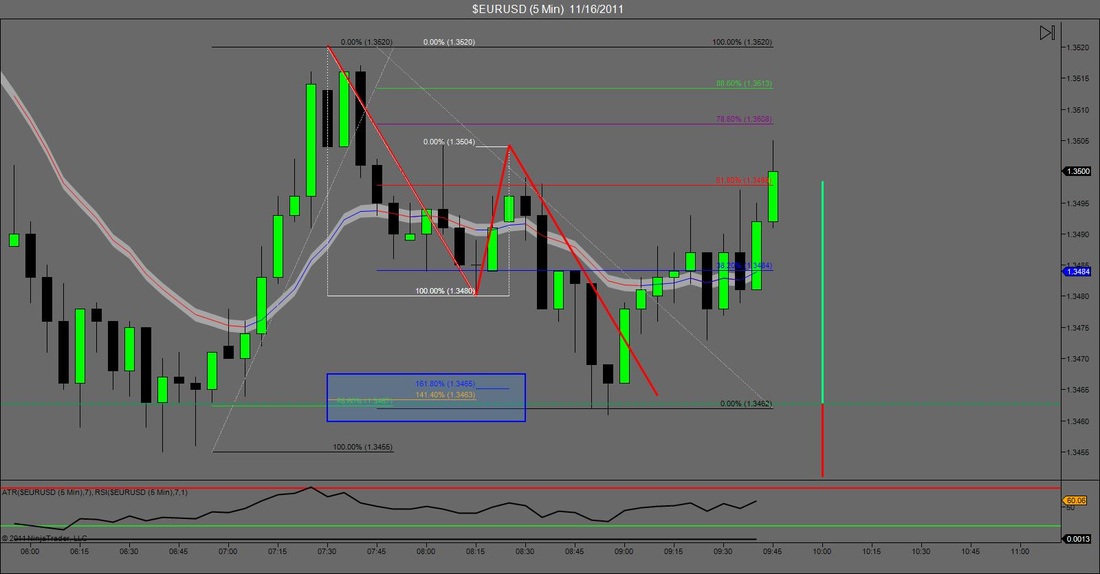
On the EURUSD 15min I was originally looking for an advanced pattern such as a gartley or a bat. However the market retraced too far to give me a valid signal by my rules. So I decided to zoom down to the 5 min chart and as always started drawing AB=CD patterns. I noticed that if it was going to complete it would stop right at the previous retracement which I deemed as structure. I then drew in some fibonacci extensions, inversions and a retracement from the original move and as you can see they all lined up at the same area. Needless to say I got involved. The rest speaks for itself.
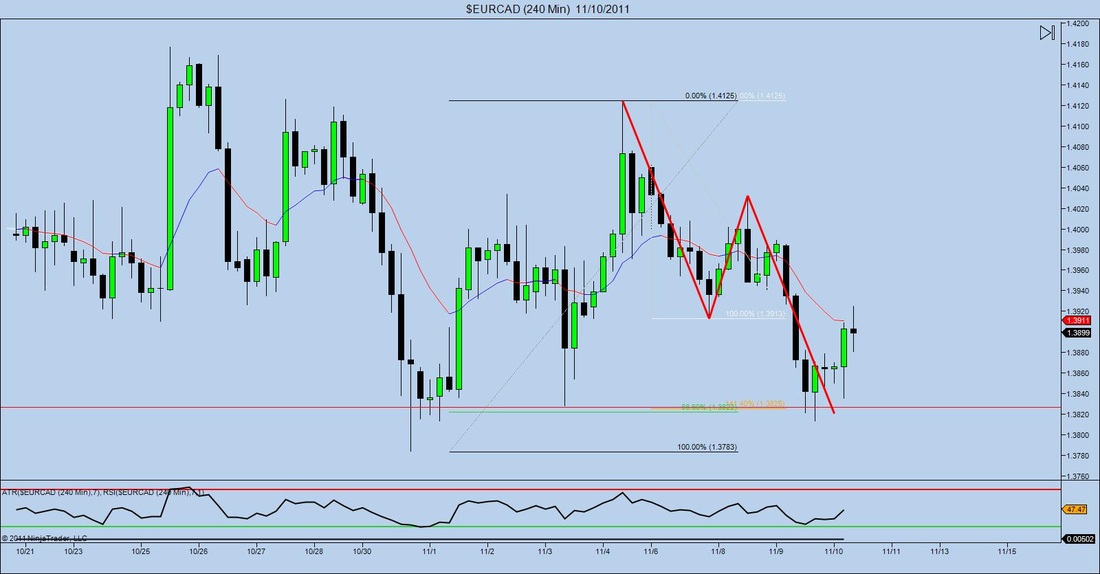
I have noticed a massive amount of ABCD patterns forming this week in the market on many different time frames. I through this chart on because it serves as a really good example since it completes at structure and some Fibonacci ratios as well which makes it an even better opportunity. Also if you look to the left of my red marks in the bullish direction there is another ABCD completion which I believe I had marked off as a part of a advanced pattern. These things are everywhere, the hard part is finding them before they complete and having the courage to follow your rule sand get involved.
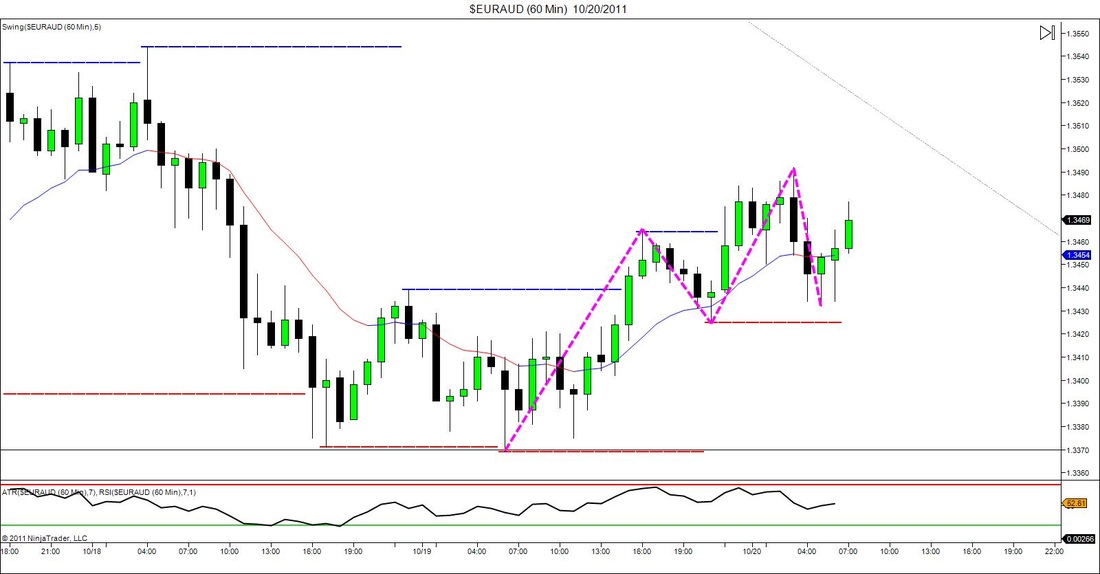
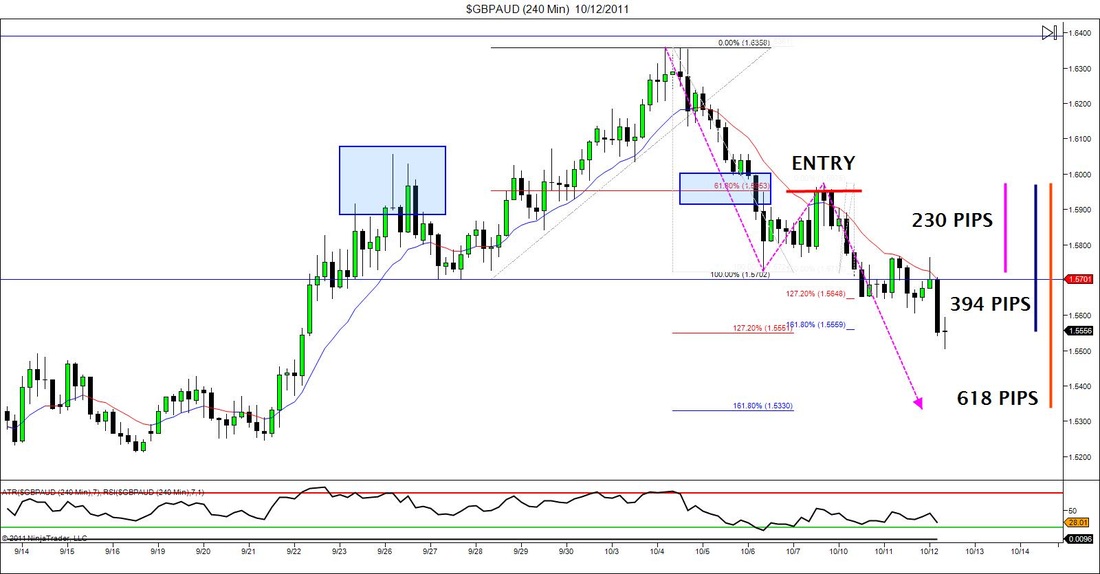
This post is a follow up to the "Training Over Trading" post that should be right under this one. In that post I predicted a trade setup but didn't take it because I didn't feel comfortable using live money on it yet. rather I decided to use it as a training exercise that would help me in the future when it comes to creating rules and putting it in my trading plan for the future. If you compare charts you'll see that the trade in fact played out in a profitable way. The 3 lines on the side are the possible targets that I would have used. Target 1 would have been collected at a retest of the base of the original entry for around 230pips. Target 2 would have either been at the Fibonacci confluence level banking 390 pips or if I'm aggressive I would continue to trail stops in hopes of an AB=CD completion for around 600 pips. I've learned the hard way, not to get greedy in this market, take your profits and ride out. But if enough testing is done, I'l be able to see which target has the most probability of being hit and create my exit rules around that data. That's a long ways away and a lot of hours of testing away, but that's what goes through my mind when looking at adding something to my trading strategy.


 RSS Feed