Here is a quick follow up to the post I wrote earlier. I don't think anymore needs to be said
|
Here is a quick follow up to the post I wrote earlier. I don't think anymore needs to be said
0 Comments
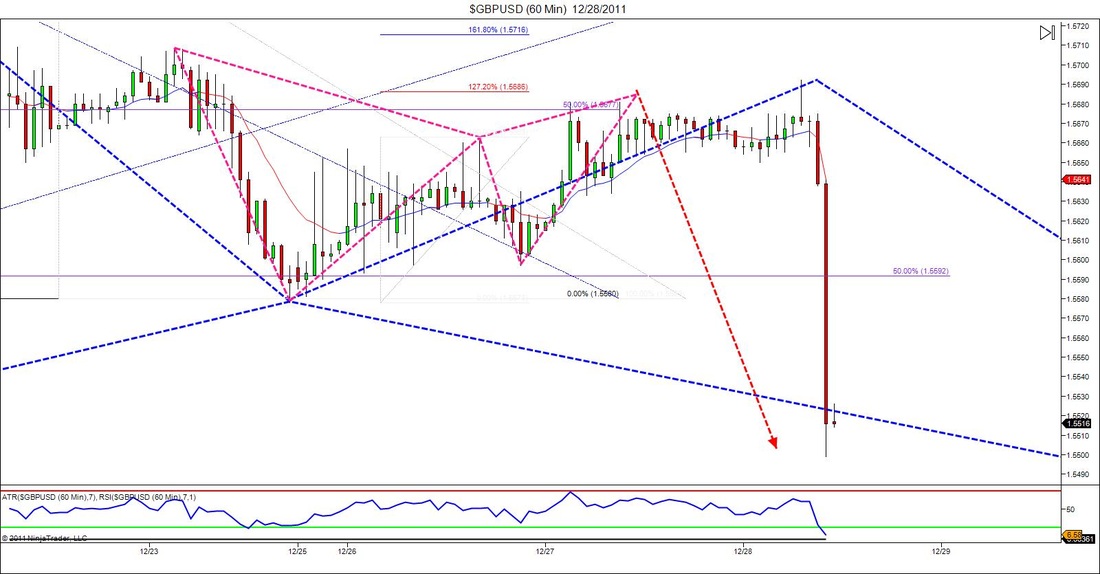
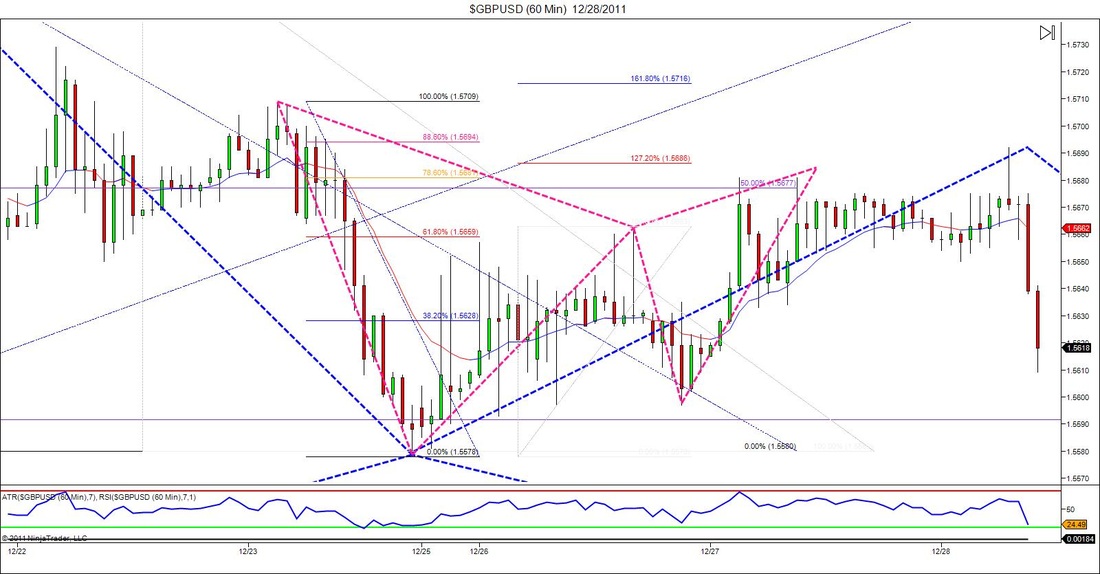 Both of these chart are from patterns that I saw on the GBPUSD. The chart above is from the 1hr chart and the below chart is of the 4hr. When doing some analysis yesterday I originally first noticed a pretty good potential bat pattern forming on the 4hr chart. However, since it was a ways away from completion I simply drew out my prediction and continued to zoom down a timeframe to look for any smaller moves. (I'm still not trading live until the new year, but I wanted to get back in the groove or routine of my analysis so I don't have any rust come Jan. 3rd.) When I went down to the hourly chart I saw a legit Gartley completion that had not quite hit my would be entry point which was a difference between the 78.6 retracement and the 127.2 extension. Price action actually bounced right off of the 50% retracement of the bigger Bat pattern which is why I liked this smaller pattern even more. When I checked back this morning I noticed that price came back and retested that area, and although the retest failed, the wick on the high candle would have gotten me filled on my Gartley entry. I didn't check the fibs on this thing yet but just from eyeing it up it looks like my 1st target would have been hit, which means stops would be moved to breakeven and all of the potential pain would have been erased. :-) 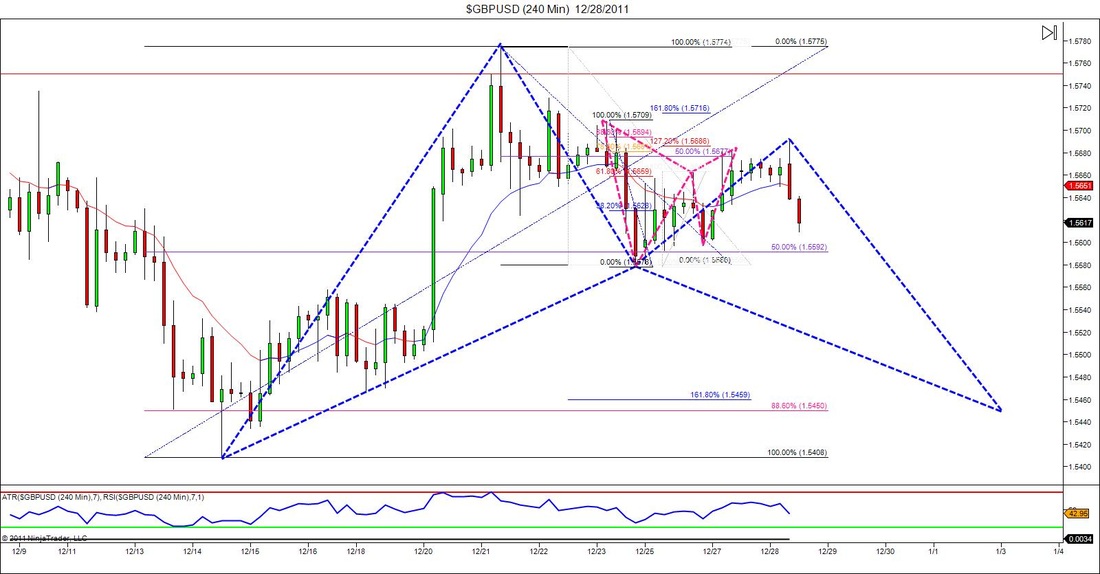 Below are three charts. The first two charts (starting from left to right) are of the EURUSD and a trade setup that I identified yesterday morning. Again, I'm done trading for the year, but I still like to get some practice and play with some ideas. (CHART 1) In this case the market had broken down and made some new structure lows then started to retrace. Whenever I see this I was taught to always ask myself "where is the market most likely to retrace to?" If you look left I highlighted the place that I predicted the market to run into some resistance at. This same resistance level also happened to line up with a 38.3 retracement of the last major down move. (CHART 2) If you look at the middle chart, I zoomed down to the 60min timeframe and threw in some Fib's to see if I would have any other reasons to get short at this point. At first I was looking for an ABCD pattern at the bottom, but it didn't extend long enough. However the 1.618 extension of that AB leg did line up exactly with the 38.2 retracement from earlier. Later I continued to throw in some more fib extensions and inversions as price action progressed and in each case there was something that line up at that 38.2 retracement. Not a bad opportunity if you entered on an aggressive order. (CHART 3) The third chart is a potential Gartley setup on the AUDUSD. Nothing fancy about this setup but I put it on here because there can actually be a smaller gartley setting up in the opposite direction. I say could be because obviously we have no idea what's going to happen until price moves, but its something you should keep your eye on. If the bigger one does complete then, there should be a pretty good risk reward ratio on the trade since it will be pretty close to structure. Something to keep an eye on for the future. 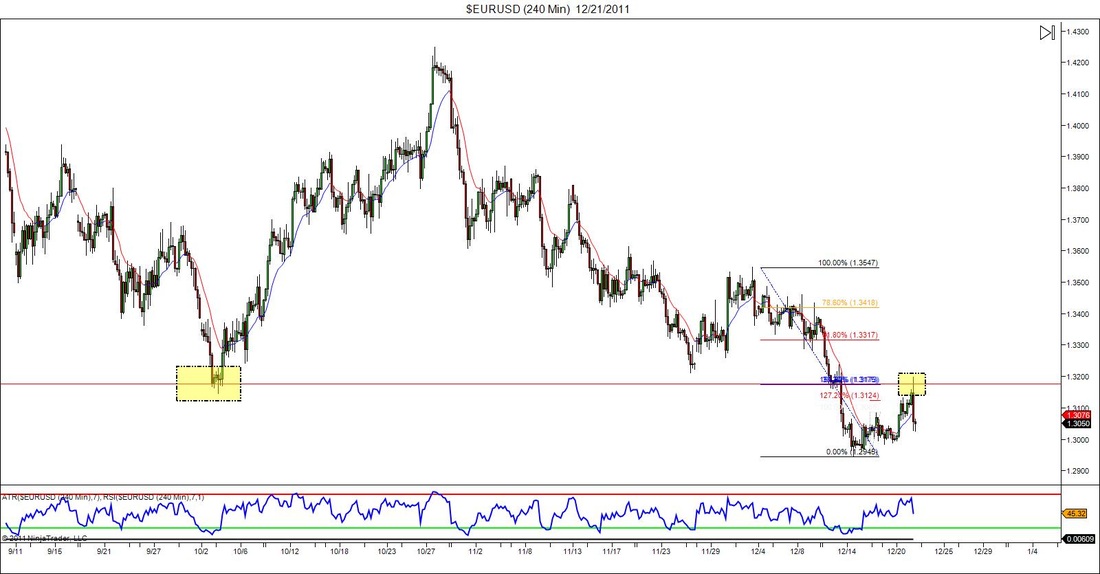 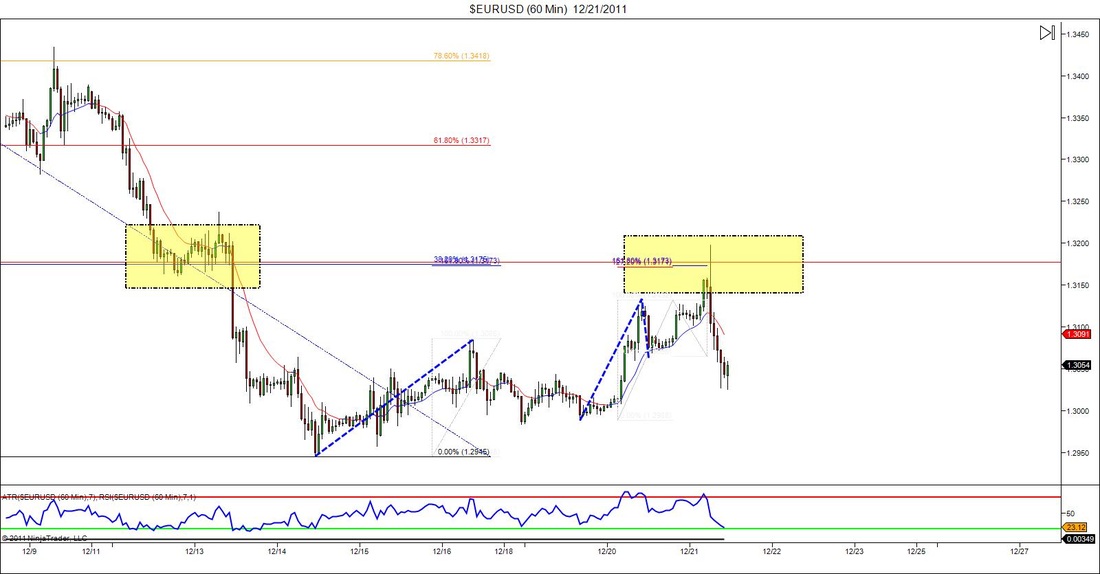 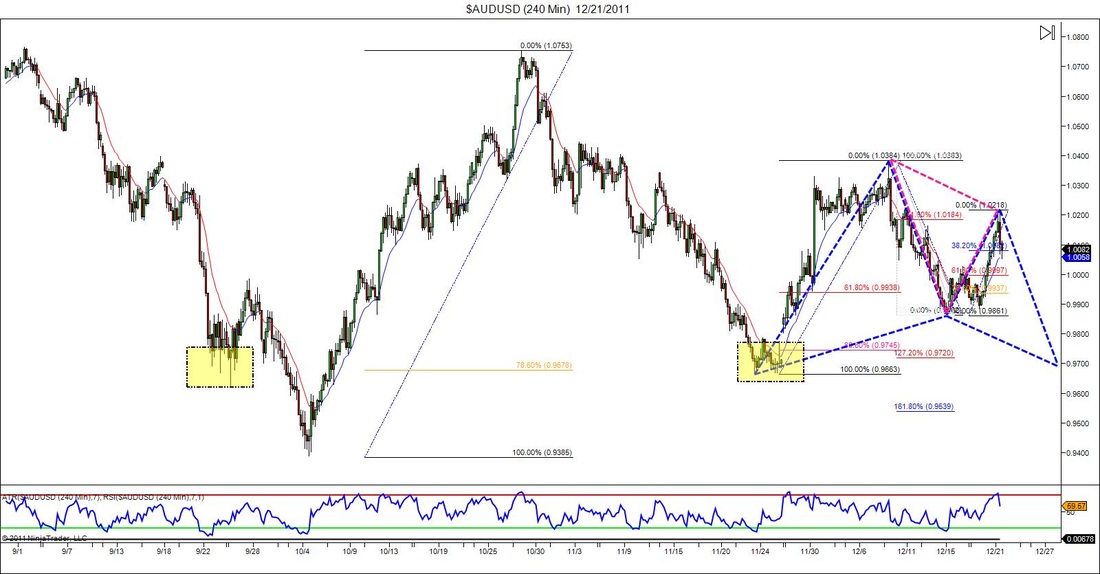 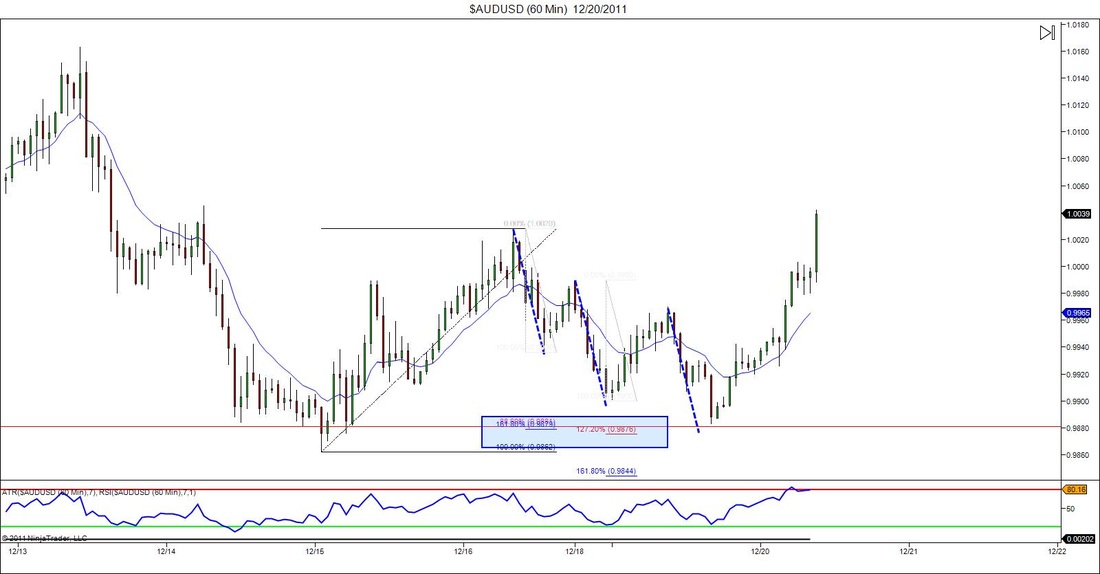
Last night a fellow trader named Andre sent me a few charts which demonstrated some pretty awesome harmonic moves in the market. One of those charts was the AUDUSD, so this morning I decided to bring it up on my computer and take a look at it. Andre noted a perfect 3 drives pattern as noted above but as i did some more analysis I also saw that the final drive ended at an area with some pretty good ratio confluence. And by pretty good I mean a 1.618 extension of A-B, a 1.272 extension of CD, and a 88.6 retracement of what would be XA. And as you can see price action reversed and skyrocketed off of that point. All I can say is Nice!
Nothing fancy here just an example of an advanced pattern that I just came across on one of my lower time frame charts. I'm not trading live this week because of the holiday season, but that doesn't mean that I still can't pay attention. The pattern above can be either a Gartley or a bat depending on the wording in your rules. Either way as you can see it would have been a very successful trade.
Slow day day trading for me so I decided to share some pretty cool vidoes that I was given this morning from Jason Stapleton. In the 2 videos below he gives a free look at what he discusses/teaches to the members of his NEW "6 Figure Syndicate" program. It's some pretty cool stuff on a time frame that you wouldn't expect and that some of you never new existed. For more info on the 6 Figure Syndicate & other programs as well as some more FREE videos/ trading ideas click the "FMP" link below 
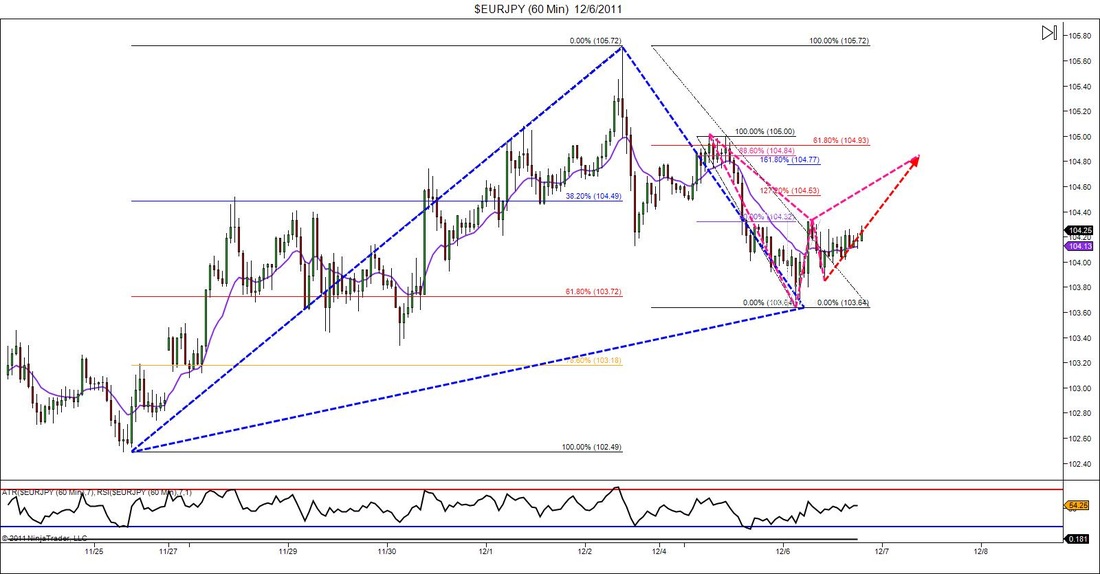
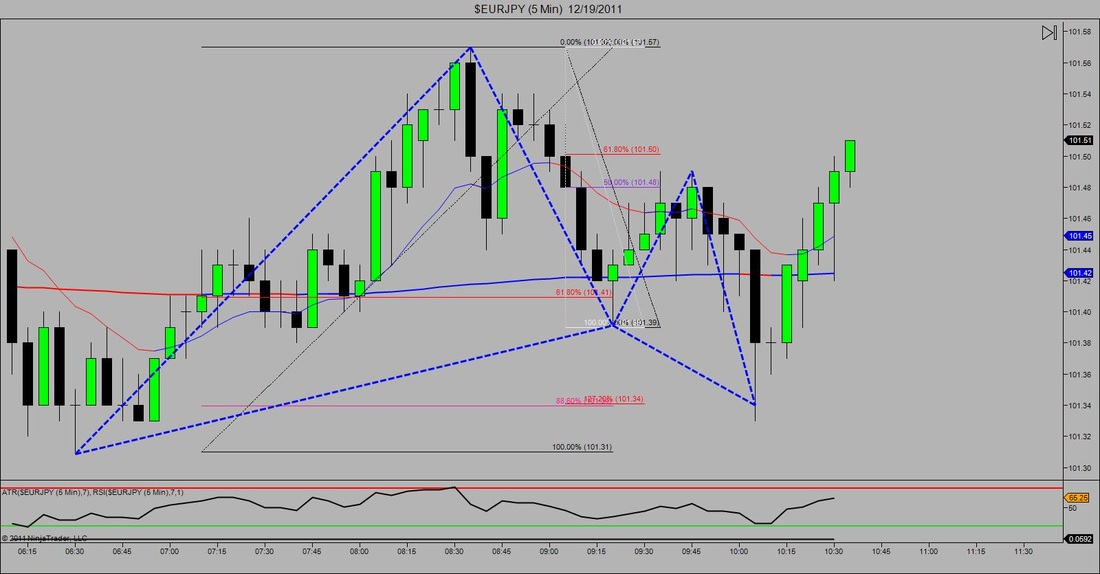
While going through my nightly analysis of the market I noticed something pretty interesting. First of all whenever I analyze charts I start from a higher time frame then work my way down. So when i was looking at the EURJPY on the 4hr chart I noticed the 1st leg of a potential Gartley pattern. At this point having the X to A and A to B legs mean nothing trade wise, but I always like to mark them down so I don't lose track of them. When I went to a lower time frame I noticed another potential advanced pattern, this time a Bat Pattern that would complete at the exact point that I would predict the next leg of the bigger pattern to turn around at. Trade wise this doesn't give me any more or less reason to enter, but it is interesting to see the possible confluence between patterns and time frames. One good thing is if the market doesn't decided to complete at that area, then I do have a great idea of where the market would want to go next.
The charts below were taken from the USDCHF on the 5min and 60min charts. I wasn't closely watching the charts today because I don't day trade on Monday's but every time I glanced over at this pair I noticed that price action still had not broken that area. At one point it started to look pretty ugly which actually made me take a closer look. When I looked closer I saw that price action was struggling to break through that area of resistance and that the market was also over sold at a point. After the numerous retest of that oversold point there was also a good amount of RSI divergence happening. Next I decided to look left to see if there was and structure present and the answer was yes. Then just to be safe I zoomed out to a 1hr chart just to see if the structure on that chart agreed with what I saw on the 5min. The answer was yes. Lastly I through in a Fibonacci extension and inversion and what do you know, there was some ratio confluence as well. So what originally looked like a bunch of junk actually turned out to be a very good trade setup. Again, I don't day trade on Monday's so I didn't take it but it was some pretty good practice which is just as valuable in my eyes. *Looking at the trade now, it just hit the 38.2 retracement which means I would have moved my stops to break even. So this now would have become a non-risk trade and mentally it doesn't get any better than that 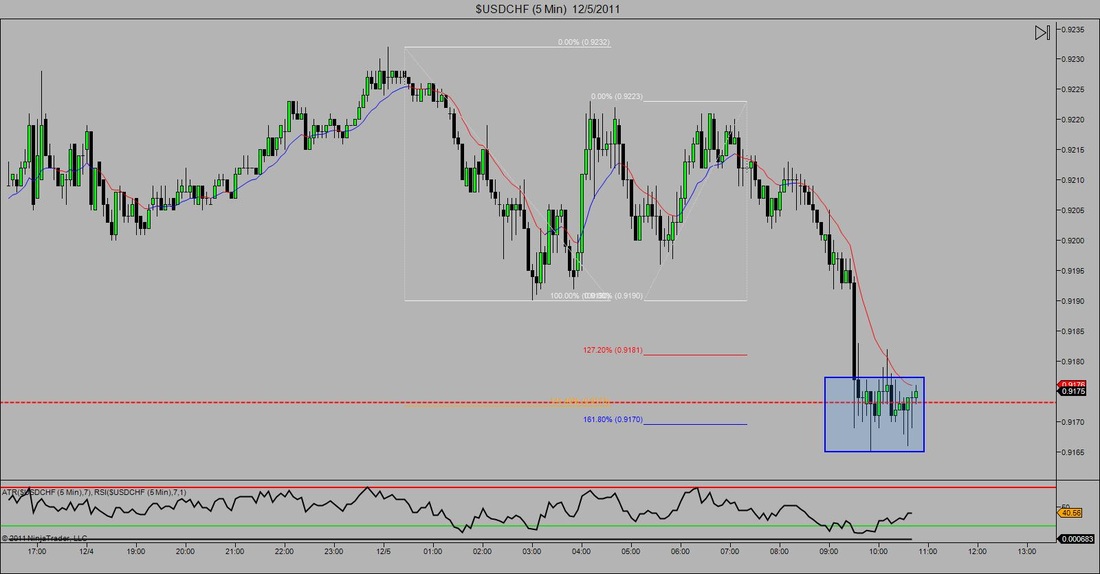 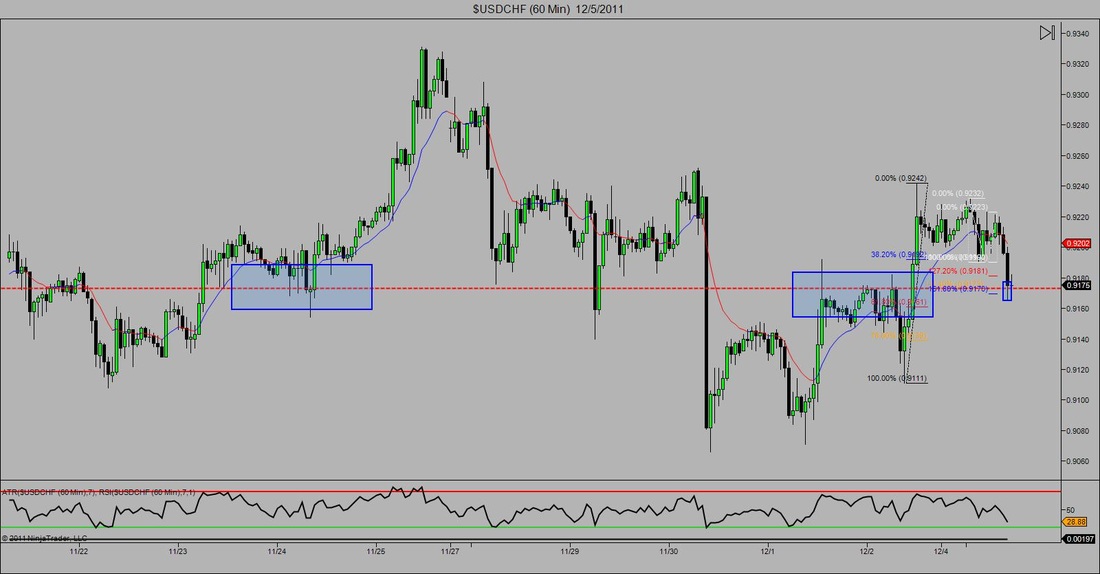 Below are 4 charts demonstrating 2 different trades that happened either simultaneously or back-to back on the same pair depending on how you trade things. I'll start with the first chart (upper left). In this chart the red line represents an area of good resistance along with some Fibonacci ratio agreement.. My counter-trend trading mindset tells me that there is a good chance that price action will stall once it reaches this level. In this particular case price action broke through and closed underneath this key structure point telling me that the market was likely to continue south. So I entered Short making my target a 1.618 Fibonacci extension. Price action then played around for a little while retesting what was now a support level before rolling over to the 1.618 (top right). After stalling at the Fib extension the market put in a perfect double bottom (Bottom left). This double bottom at the 1.618 extension offered the perfect chance to get into the market long as a countertrend trading opportunity. Long story short price action shot right back up. Now I didn't get involved in the 2nd move because I already had a position going short and was waiting to see if my 2nd target would be captured. By the time I was stopped out for break even, the market was too far gone for me to get involved but for an advanced trader you can easily see how both moves could have been taken advantage of. 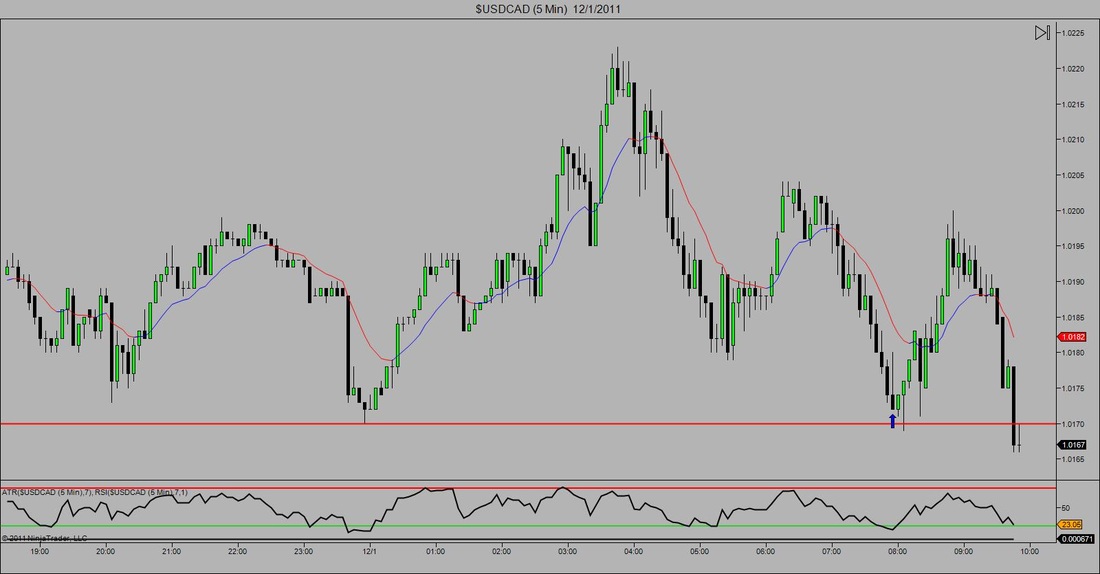 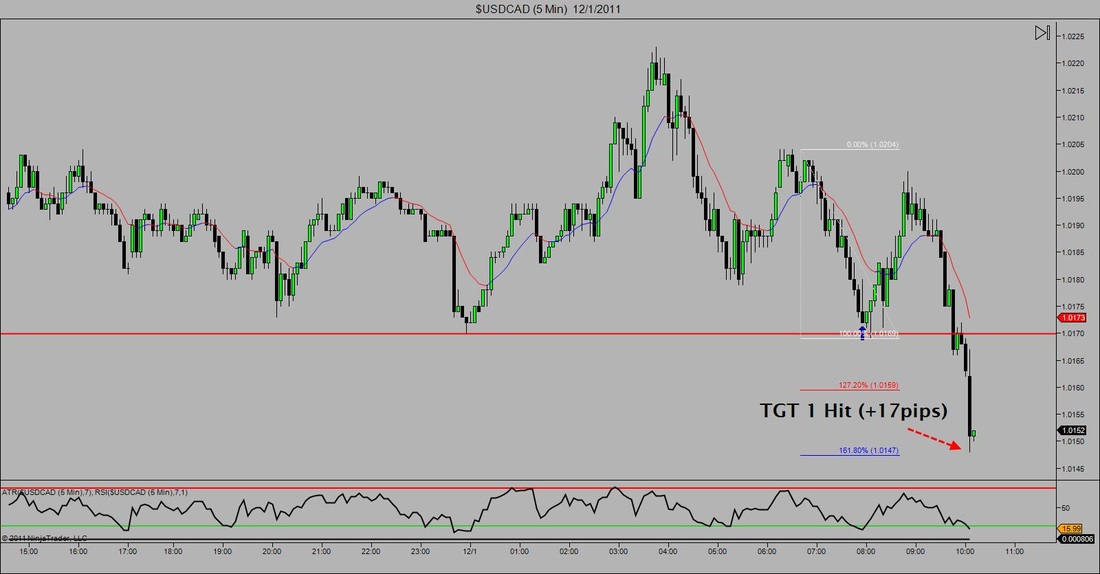 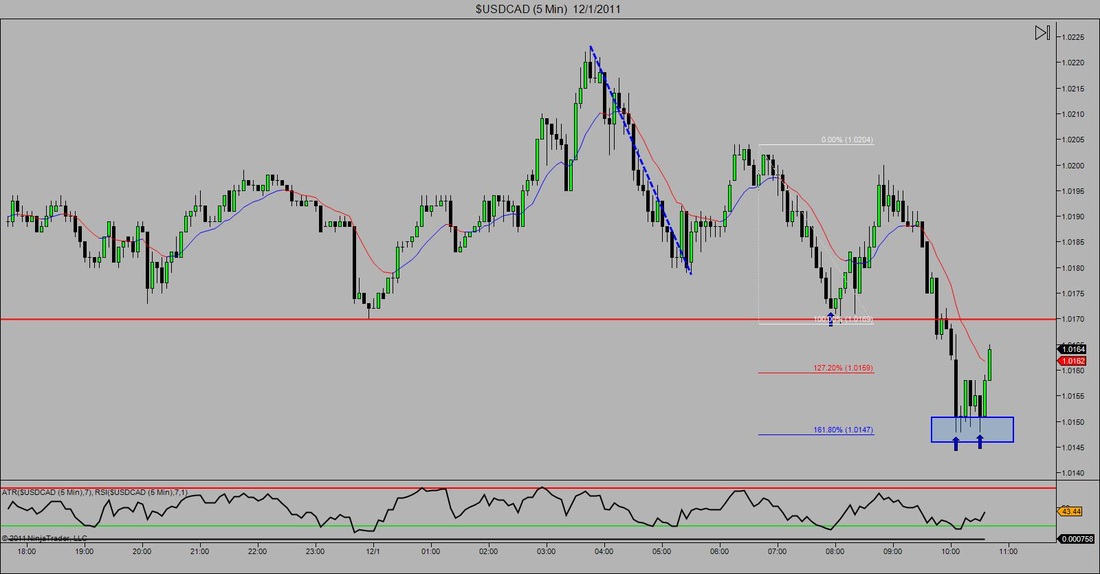 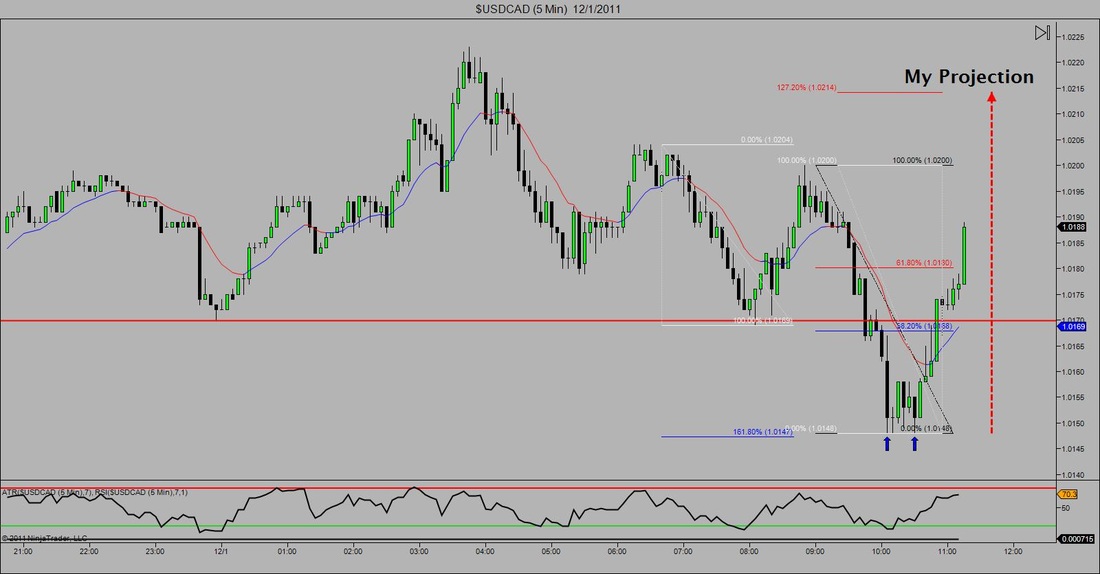 | 
"6 Figure Syndicate"

"Live Ratio Room"

"Pro Trader 2.0 Course"

"The Founders Series"


Akil L. Stokes*My intentions are not to provide you with entries, exits, or targets, only to give a closer view at what I'm looking at when i'm involved in the market. Please understand that I am not a certified market technician, simply a self-employed professional trader in the Forex market.* ArchivesAugust 2012 CategoriesAll |
 RSS Feed