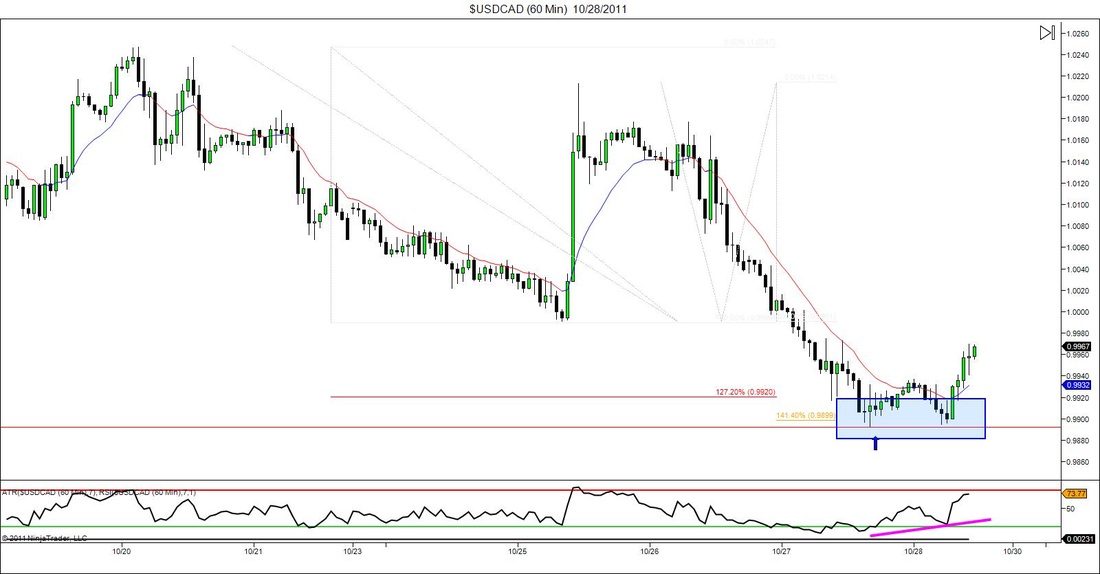
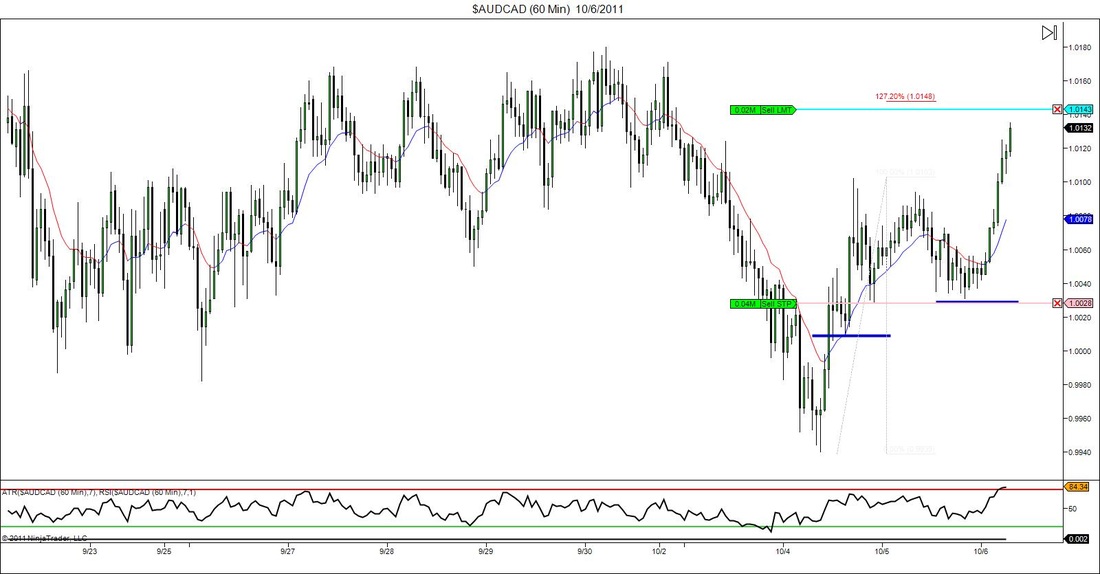
Nothing fancy about this chart just a simple double bottom on USDCAD. I noticed this last night when the market originally went overbought but my rules didn't allow me to place an aggressive order since there really isn't much major structure nor Fibonacci confluence. Therefore I was going to watch it closely for a retest with some RSI Divergence and see if I would get a chance to enter. If you read what I put under the "Morning Thoughts" section on the homepage then you'll see what kind of issues I had this morning, but long story short, price action had already moved to far for me to get involved at a price of my liking. Either way it still proves to be a good trading example and if I remember correctly there are some other ones setting up on a few other pairs on some longer term charts.
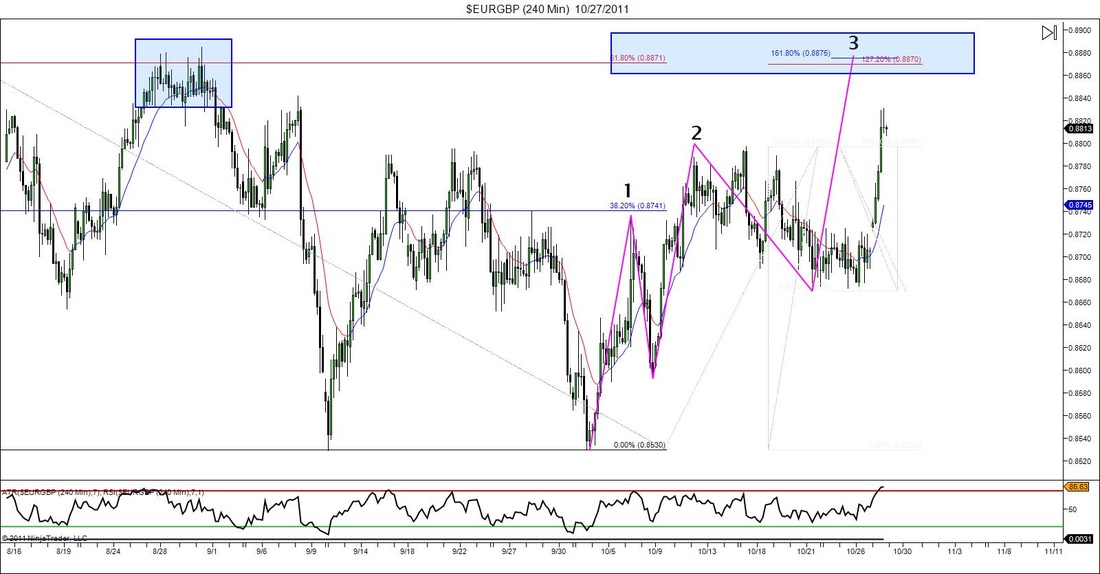
Another post so soon? YES! This setup looks even better than the last one I just posted. On the EURGBP pair there is a potential 3 Drives pattern that will complete at Fibonacci confluence and some structure if you look left. The Fibs I have marked are the 1.272 of the original ABCD move and the 1.618 is an inversion of the retracement that comes after the original ABCD. There is also a 0.618 retracement that comes from a bigger overall move. I just measures it for giggles and it winds up lining up right with the other two hmmmm. Add that to a possible equal move of AB and CD and I've got enough reasons to get in aggressively. Of course you should use your own rules and not follow me. Just something that seems as if it could be good.
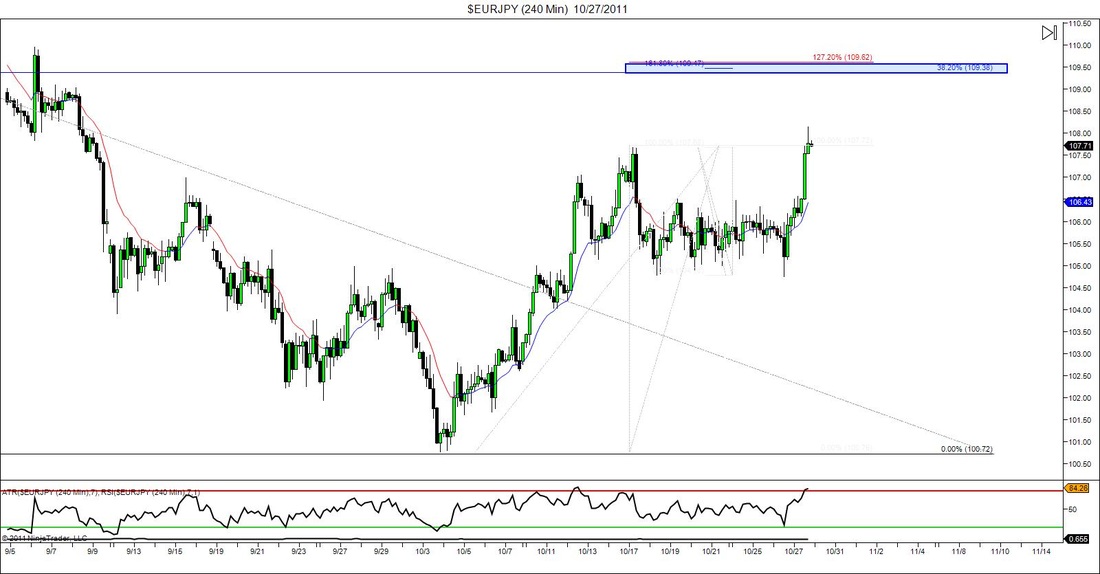
It has been awhile since I've posted anything, but in all honesty there hasn't been much going on in the market, unless you're a channel trader, then you've probably had a field day with some of these pairs. Anyway, things finally seemed to start moving again over the past few days and while going through my PM analysis I noticed a potential reversal zone to watch on this chart. Now in no way am I saying or predicting that the market will indeed reverse at this point but there is some interesting Fibonacci ratio confluence between the 109.40's & 109.60's area. The Fibs I took were a the 1.272 extension the the most recent up move (A-B) & a 1.618 inversion of the retracement of that move (C-B). There is also a 0.382 retracement of the latest down move measured from a daily chart. Obviously you can't see it on this chart but trust me it's there. Do I have a sell limit placed at this zone?....Nope. But I will be keeping my eye on it and keep building my entry reasons as/if price action decides to reach it. There is some minor support near that zone as well which is a plus, but on the down side, if this pattern decides to complete a C-D move that is equal to A-B (giving us an AB=CD pattern) then that will take us to a much higher level which has some very good structure of it's own. We'l just have to wait and see what happens.
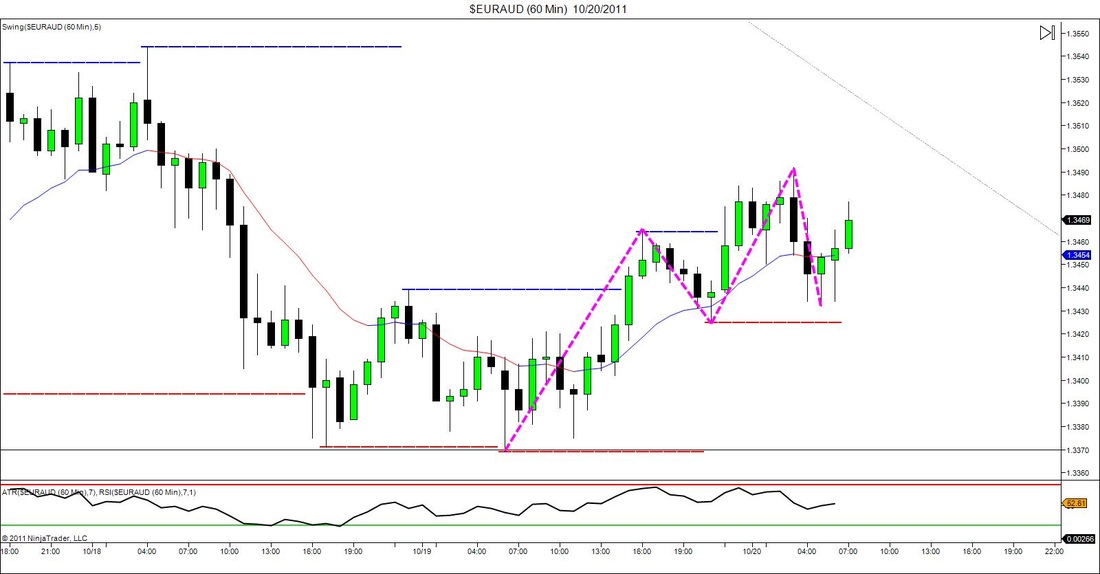
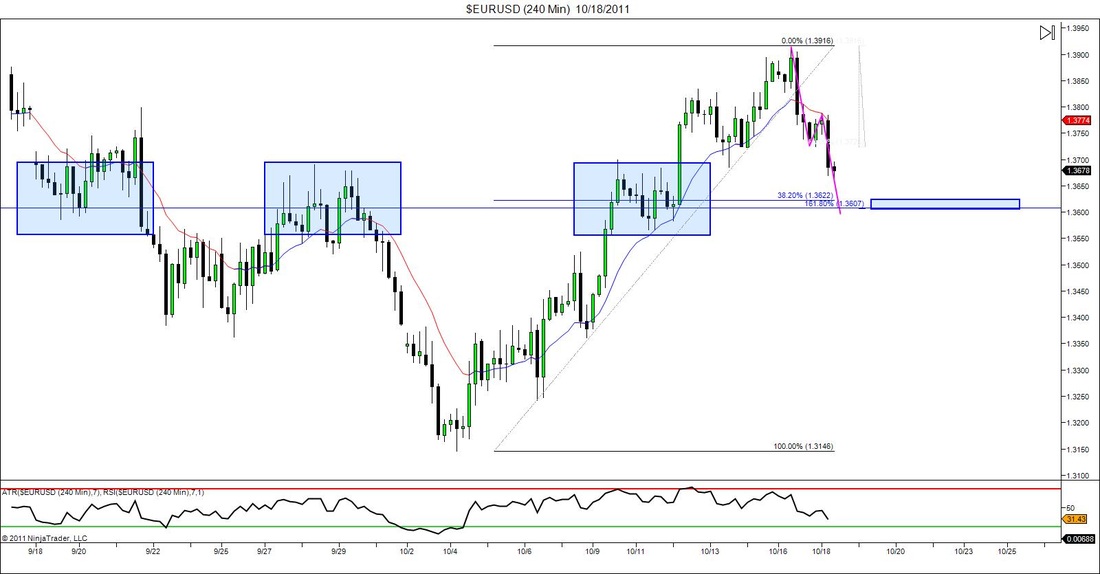
Not much in the market I'm excited over but that doesn't stop me from drawing in lines and practicing my technical analysis. After-all it is a skill. Anyway with this chart I simply drew in a "What If" AB=CD pattern and saw that would indeed complete at a 1.618 fib extension which is always a good sign. this extension also lines up in an area very close to a 38.2 retracement level of the impulse leg to the left. Add to that there is a past history of market choppyness or structure. Nothing really dead on but as a whole that area looks prime for something. I personally don't have anything in my rules to trade this strictly on what I see now. But if price action does get down to that general area I will switch down to a lower time frame and see if I can catch a double bottom and get involved. If not then I just sit back and watch and call in a learning experience. My goal is not to lose money so if I'm not 100% comfortable with a trade set up I simply sit back and watch.
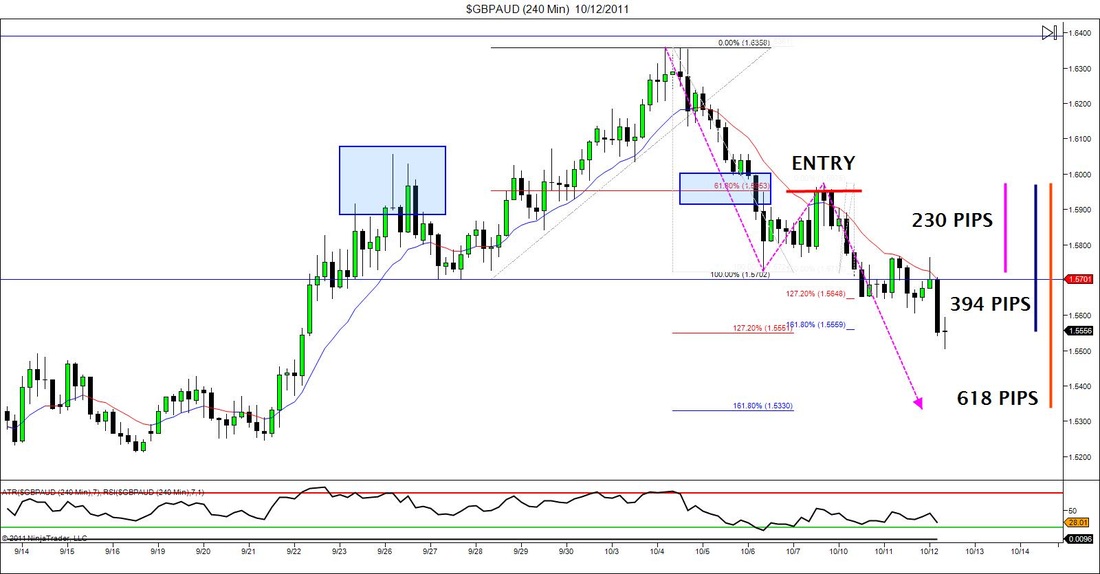
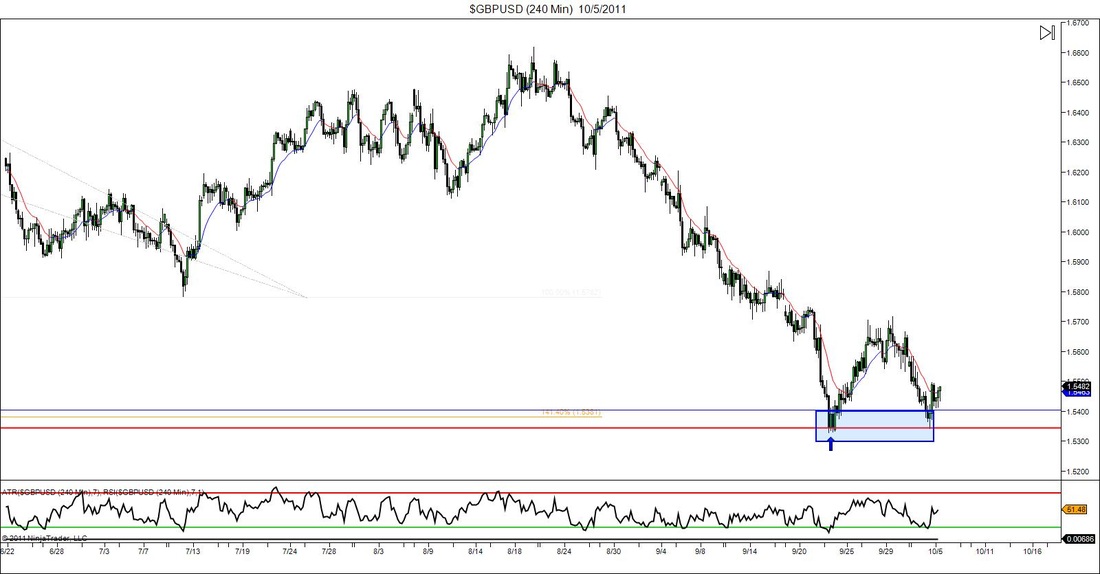
This post is a follow up to the "Training Over Trading" post that should be right under this one. In that post I predicted a trade setup but didn't take it because I didn't feel comfortable using live money on it yet. rather I decided to use it as a training exercise that would help me in the future when it comes to creating rules and putting it in my trading plan for the future. If you compare charts you'll see that the trade in fact played out in a profitable way. The 3 lines on the side are the possible targets that I would have used. Target 1 would have been collected at a retest of the base of the original entry for around 230pips. Target 2 would have either been at the Fibonacci confluence level banking 390 pips or if I'm aggressive I would continue to trail stops in hopes of an AB=CD completion for around 600 pips. I've learned the hard way, not to get greedy in this market, take your profits and ride out. But if enough testing is done, I'l be able to see which target has the most probability of being hit and create my exit rules around that data. That's a long ways away and a lot of hours of testing away, but that's what goes through my mind when looking at adding something to my trading strategy.
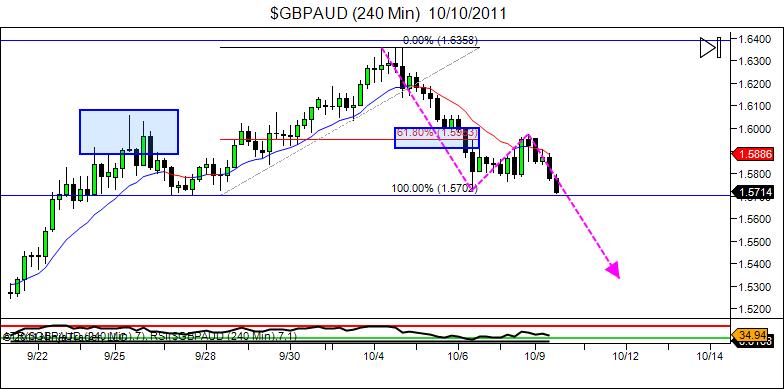
This is the trade setup I was talking about in the post titled "training Over Trading". Here is what I was looking at. At the top of the screen we have a structure high which proceeded to rollover. I took a Fibonacci retracement of this move and saw that the 0.618 came in at a nice looking structure area. At this point I told myself that there was a good chance that the market would be sucked into this point and then either reverse back down on or continue to go up. Because I would have been presented with a great risk/reward ratio it would have been a worthy trade to risk 1 to gain 2. If I was trading live I would have went down to a smaller time frame to get the best entry possible and Target 1 would have been where price action is at in the picture above. Target 2 would then be at the completion of the potential ABCD pattern. If you read my post, then you'll know that I didn't trade this setup live, but I did learn a lot from it.
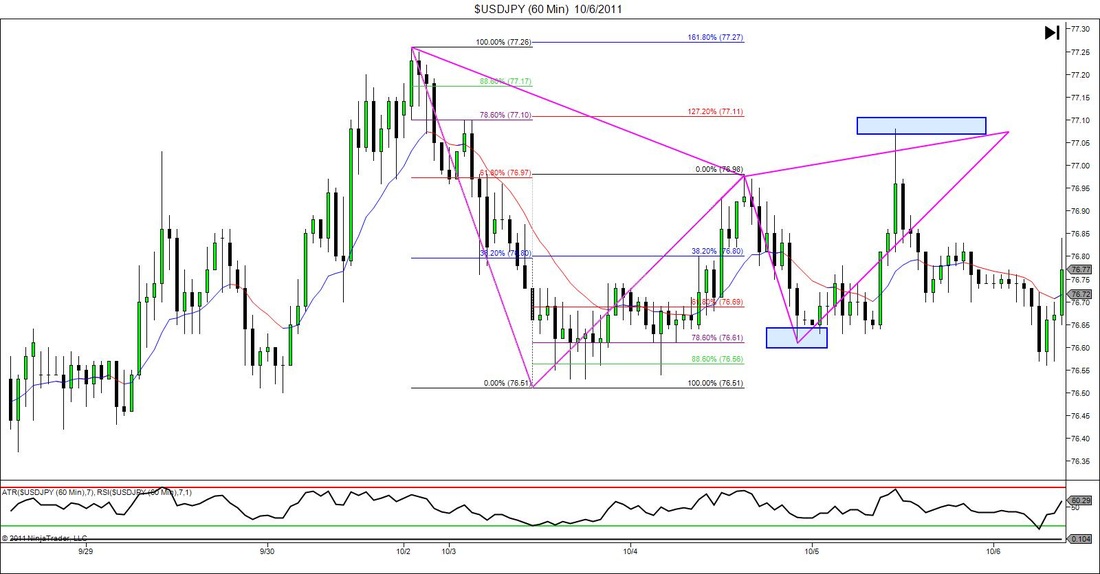
Here is a trade that I found last night while doing my evening analysis. It actually occurred on my most hated pair the USDJPY. Ok, I honestly don't hate this pair, I just always find it difficult to analyze because of how it moves. It's also often a bore to trade because it moves so slow (from my experience at least). Anyway I posted to chart to show that even on an non-attractive pair, valid signals occur. in this case it was a bearish Gartely pattern that formed within a choppy market. The move was quick as most Gartley's are, but it would have been profitable. Again I missed this opportunity, simply because I didn't see it at first glance, but hopefully as I grow as a trade my eyes will be able to catch such patterns.
I just wrote a post under the "Follow A Pro Trader" Blog with the same title. For a description of this chart please read that post.
Here is a picture of a trade that I took yesterday. When zooming you you can see that a large impulse leg was formed that hit a point of major structure support (from the past). It then retrace a little bit and came back down to re-test that same area. After seeing the RSI divergence on this trade I became the perfect opportunity to get a low risk entry. Low risk meaning that I would have a good risk/reward ratio (amount that I could gain compared to the amount that I could lose). After the market wiggled around a little bit I was able to move my stops up a bit to save myself from a bigger than necessary loss if the market decides to reverse. Trade management is just as import as spotting good trading opportunities.


 RSS Feed