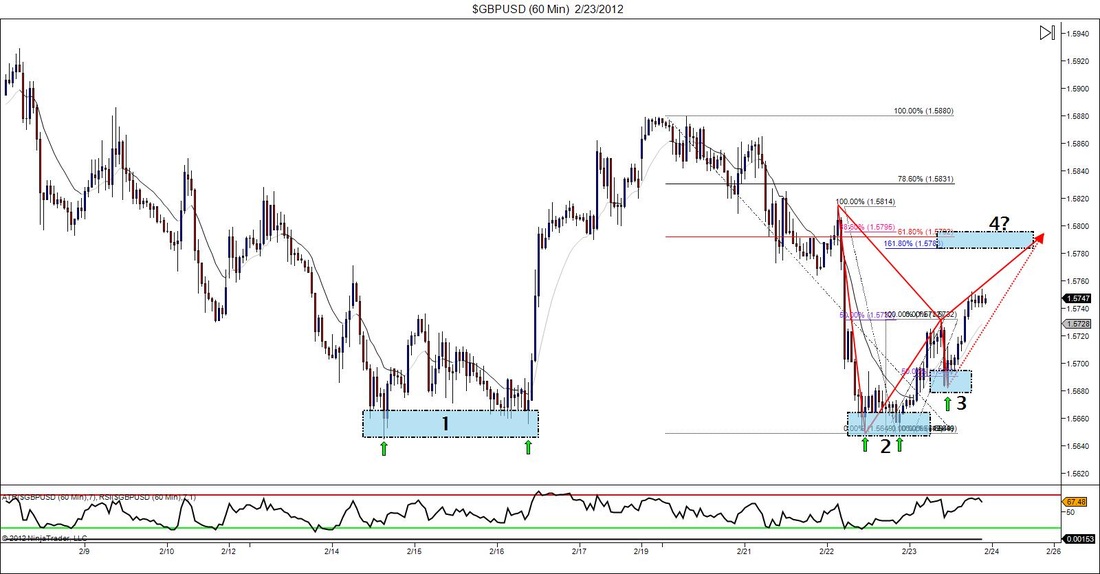
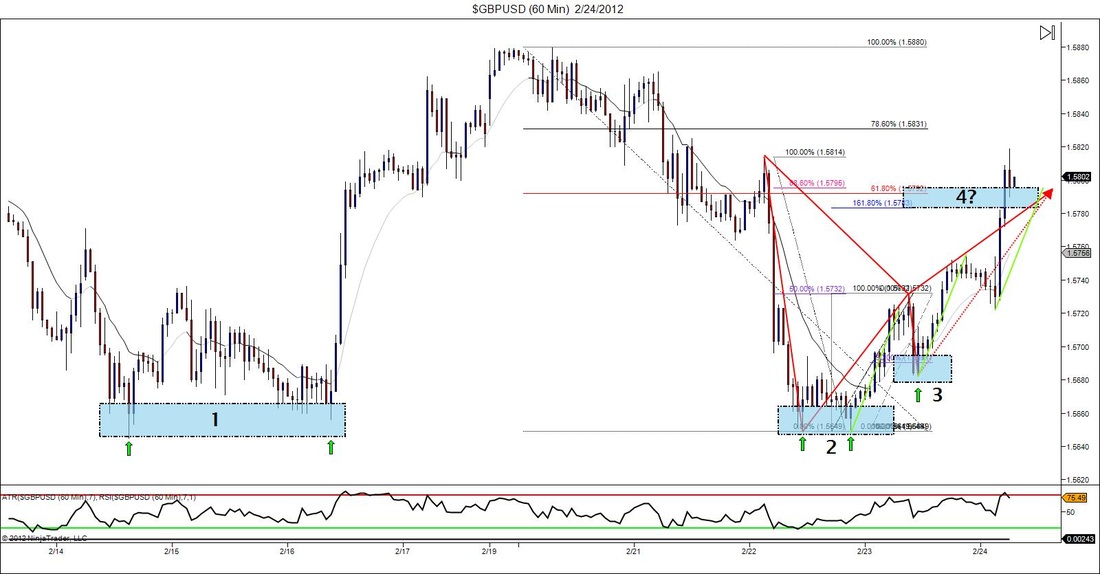
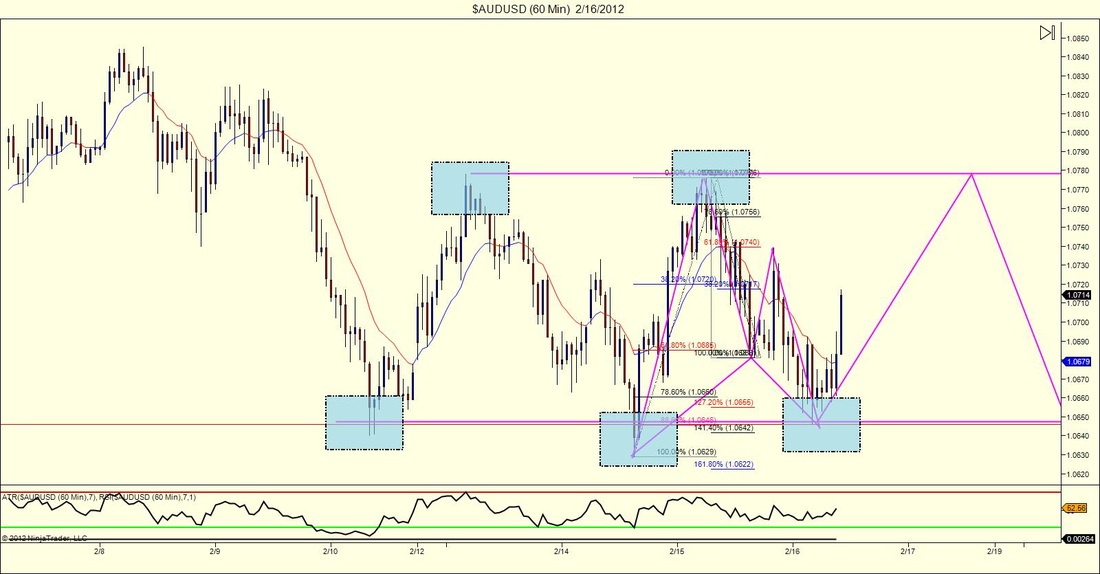
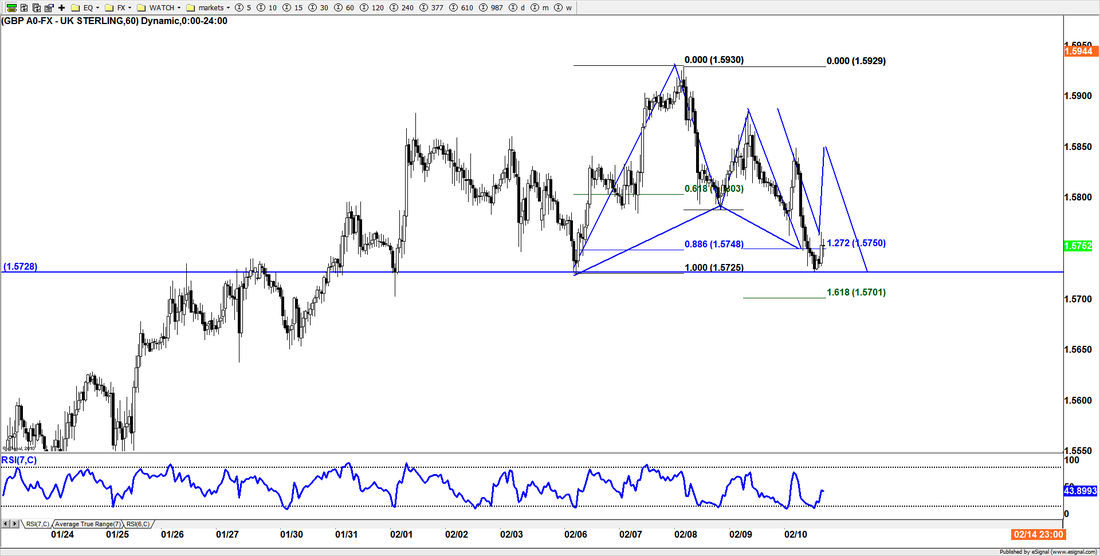
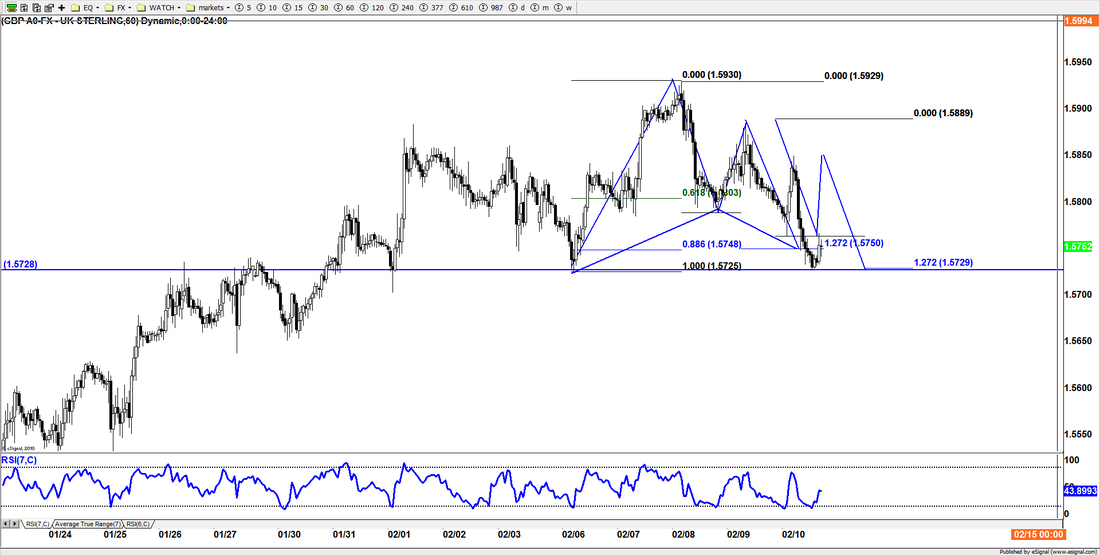
I hate to pick on a single pair like this, but ever since last week it seems like the cable has been opening itself up for some serious trading abuse. Let's follow the numbers: first the market gave us a double bottom before shooting up for some money in the bank. After retracing, the market gave us another double bottom at the same area, daring us to buy again. Although the market didn't jump as much as it did the first time, it still allowed for some pretty good profit taking. It then retraced back into the structure area giving those who missed the second trade a chance to get involved. Hopefully they didn't pass on that opportunity because, well as you can see see the market shot up for a third time offering even more money for us greedy traders (as Jason would say). Lastly the question is where is the next valid point. Well my prediction is possibly box #4. When I started writing this post last night I saw that there is a bat pattern completing at that level and as I loaded up the charts this morning, I noticed that price action didn't stop exactly at that point, but it also didn't invalidate the pattern. Add to that the fact that a 3 drives completion is at that same area makes it Either way we sucked enough money out of this market to make up for a loss. Keep winning traders!
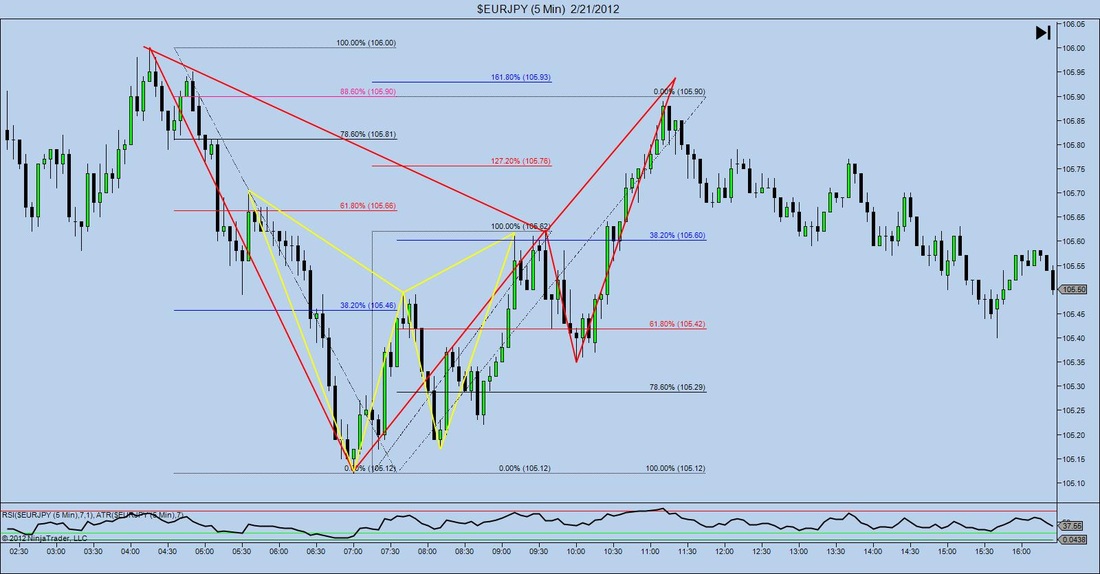
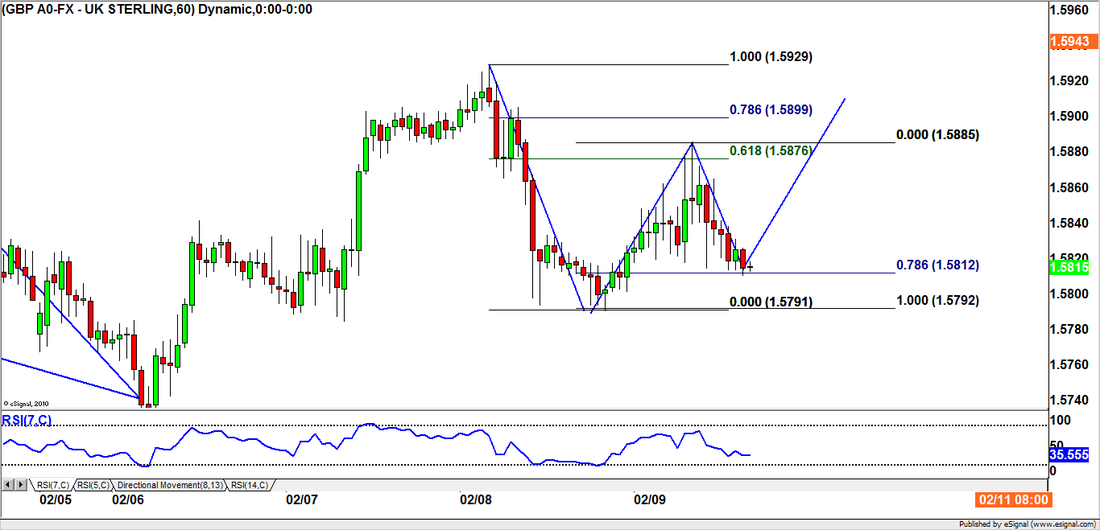
Above is a picture of a trade...actually I should say trades that we took in the live room today. The first trade we took was a gartley pattern market in yellow. This trade ended up hitting target 1 before retracing and stopping us out for break even. This same pair then continued its move upward giving us a valid bat pattern which we also took and as you can see was also very profitable. Pretty cool, but also pretty simple once you know what to look for. Having 60 other eyes in the live room helps a lot. Especially on the 5 minut
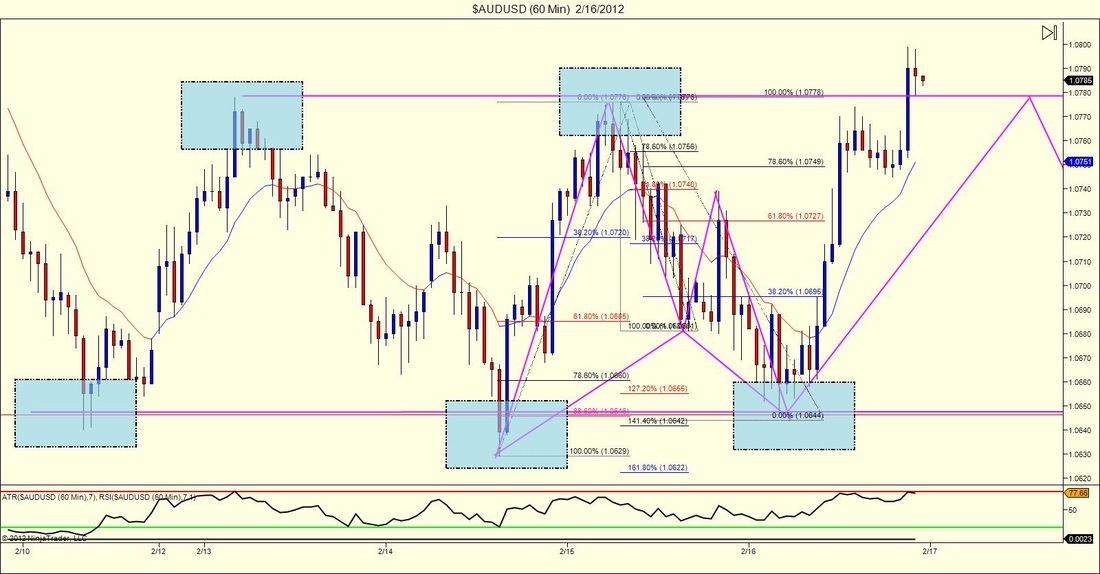
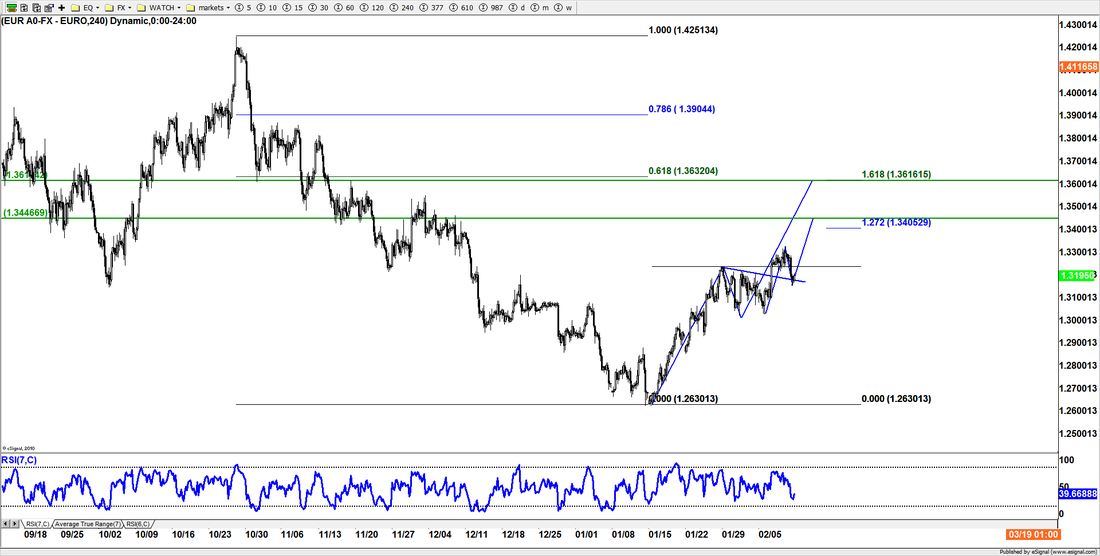
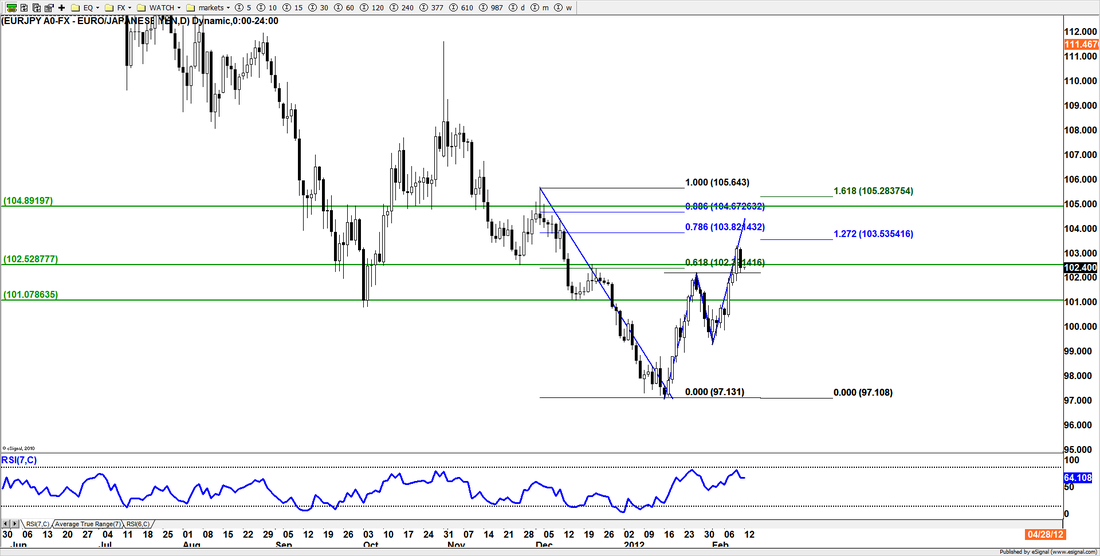
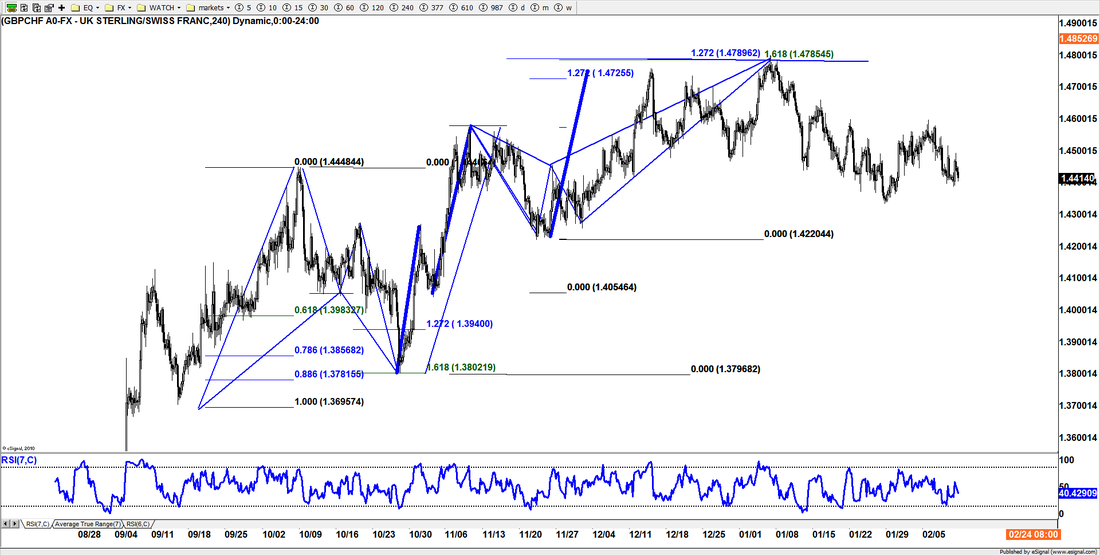
I know this can't top the 16 chart post I put up the other day by one of my trading friends, but today I've got a few cool charts worth looking at. Above is a great example of how a trader can make a killing in the market once they truly understand market harmonics and advanced patterns. While looking at this chart in the live room a few of our traders pointed out that not only did they catch the last pattern move but they also caught (going from left to right) the original bat pattern, bought it up for profit, then waited for the ABCD to complete and bought that up for profit, then finally sold the last pattern for profit as well. My trading mentor always told me that the amount of pairs you trade doesn't matter and that they're are traders that just do fine watching a single market on a single timeframe. This was a great example of how that could me done.
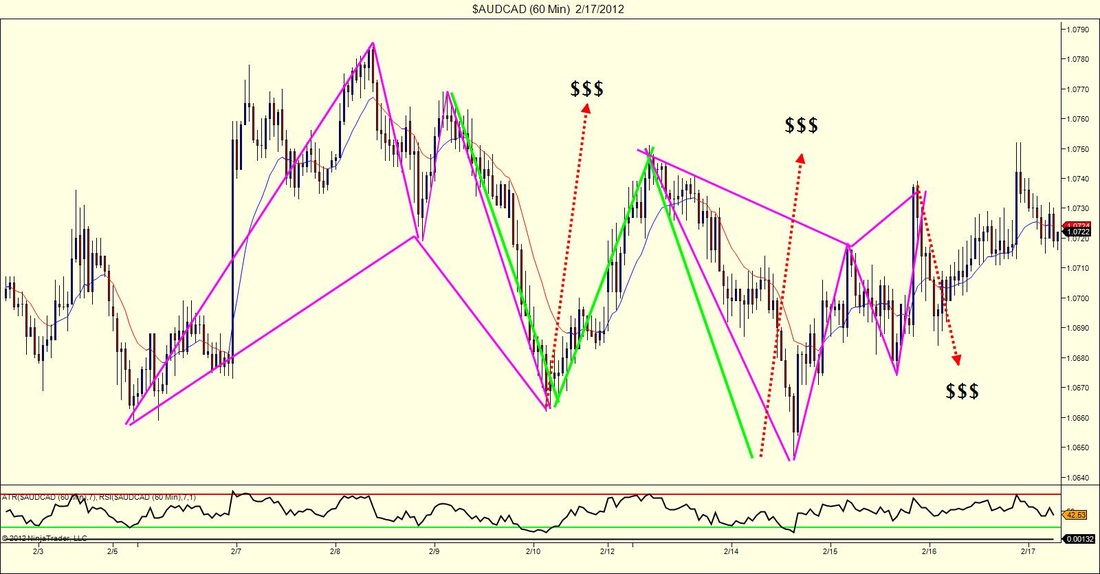
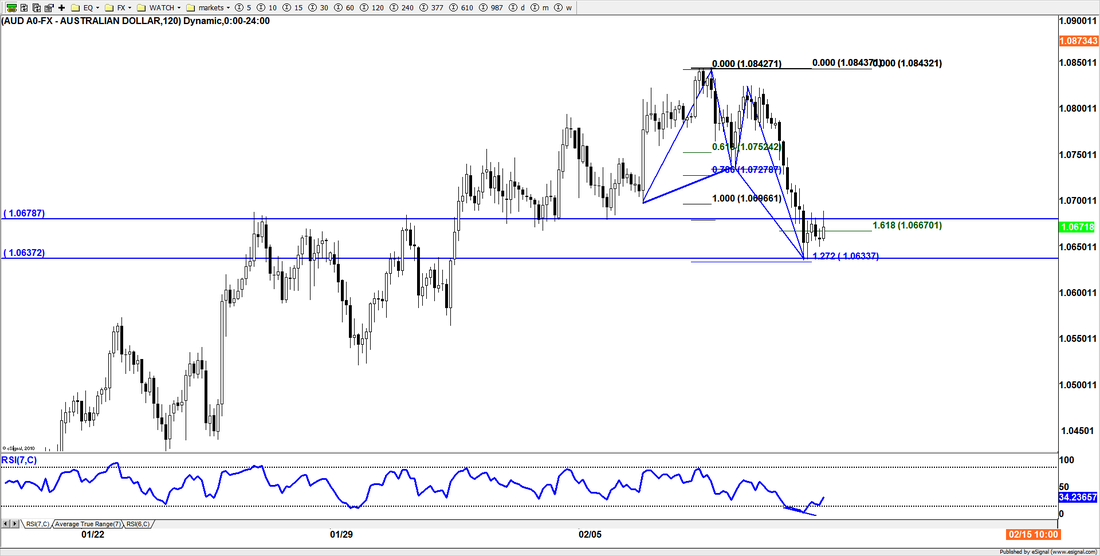
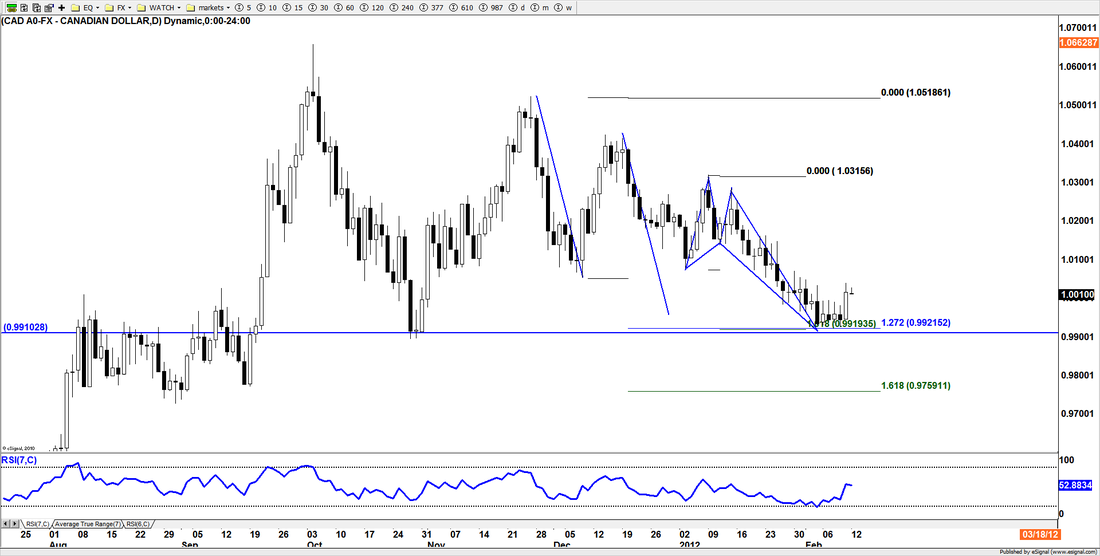
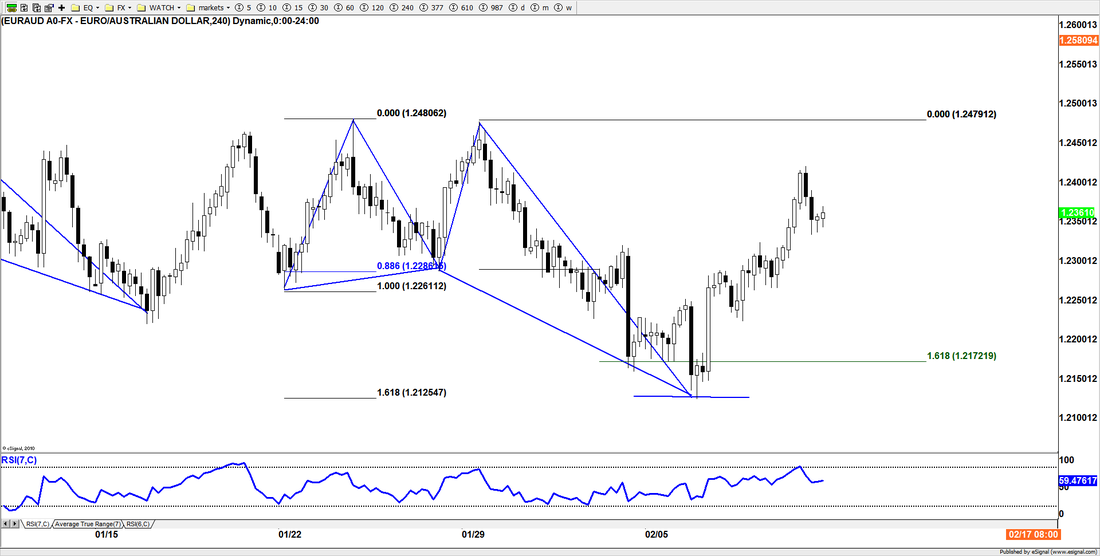
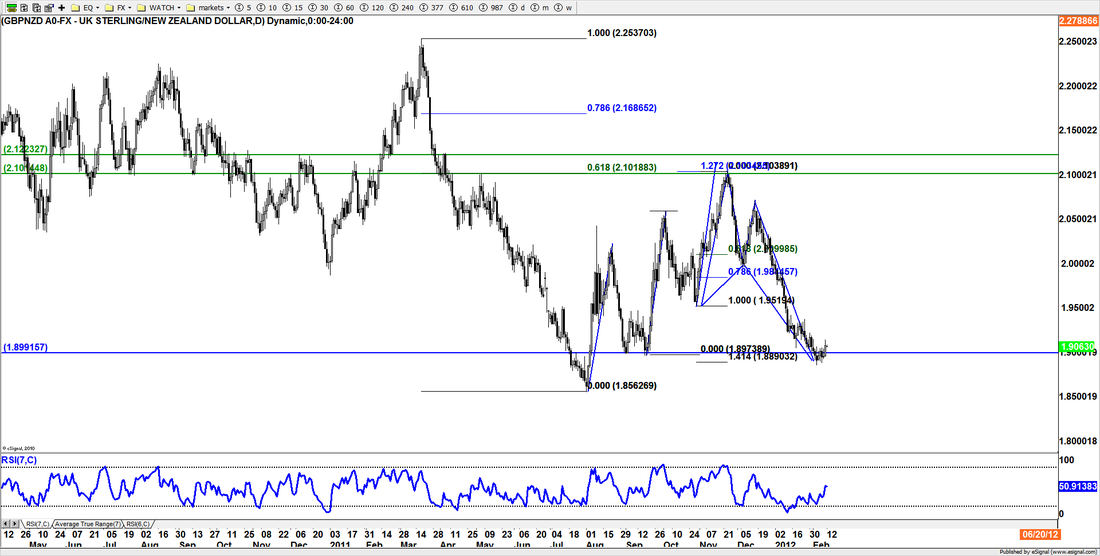
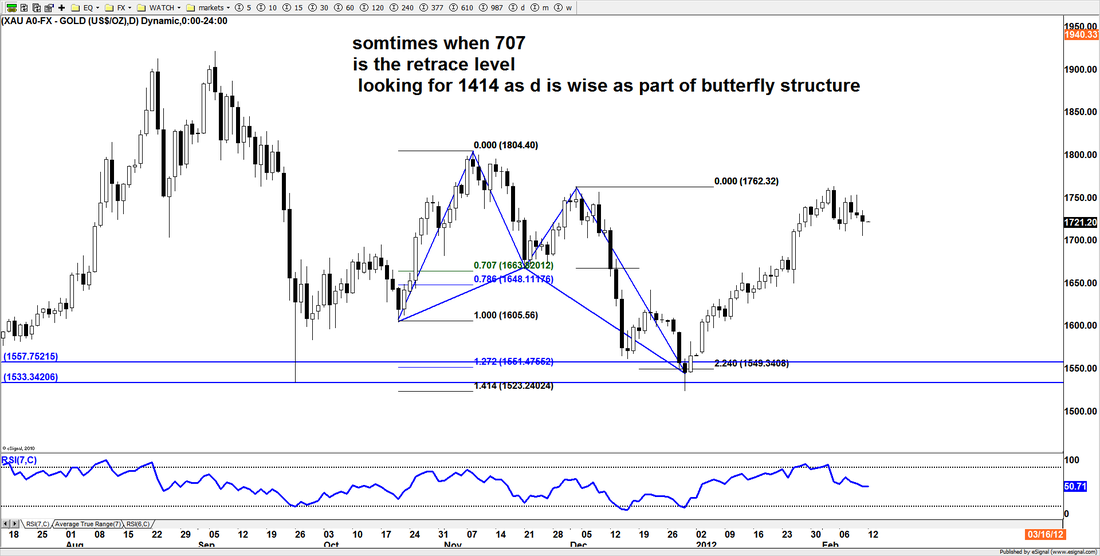
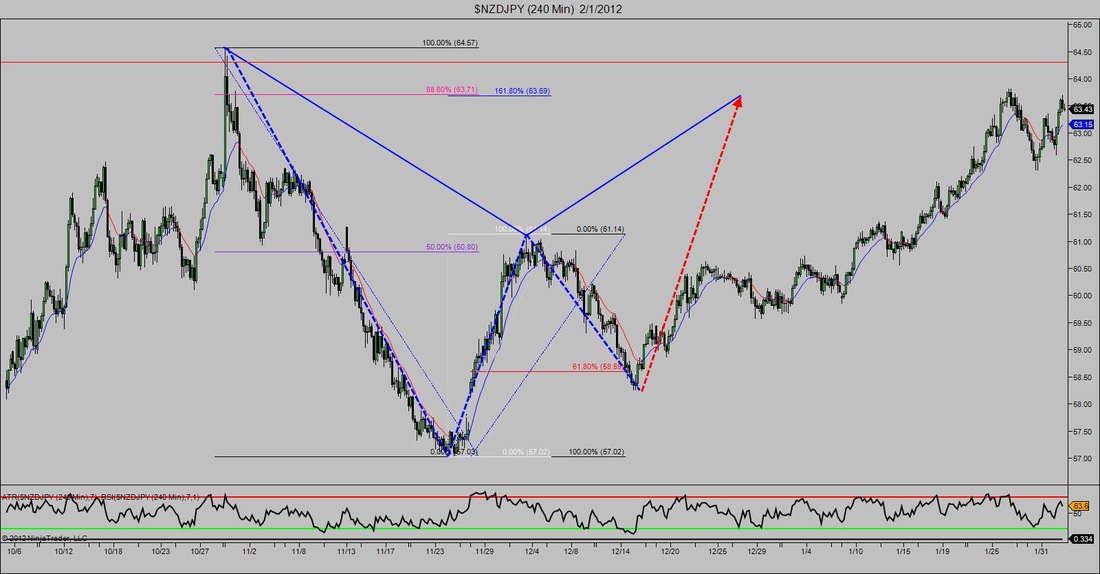
Below is a second example of how understanding the market can pay off. Not just with finding trades to enter, but with predicting zones to take profit. On this pair below you'll see a few things, a channel and an advanced pattern completion. Personally, I'm not a channel trader, but that doesn't mean that I can't use it in my analysis to predict trades and profit areas. Aside from the channel you'll also notice the completion of an advanced pattern right at the bottom of the channel. Hmmm... could this be a good area to buy? HECK YEAH! Not only does the multiple setups give us more confidence and reasoning to buy, but knowing how channels and patterns work, we can then predict where the market wants to go and extend our take profit zone to...well I'm sure you can predict where. If not simply check out the the final chart below. Beautiful stuff!
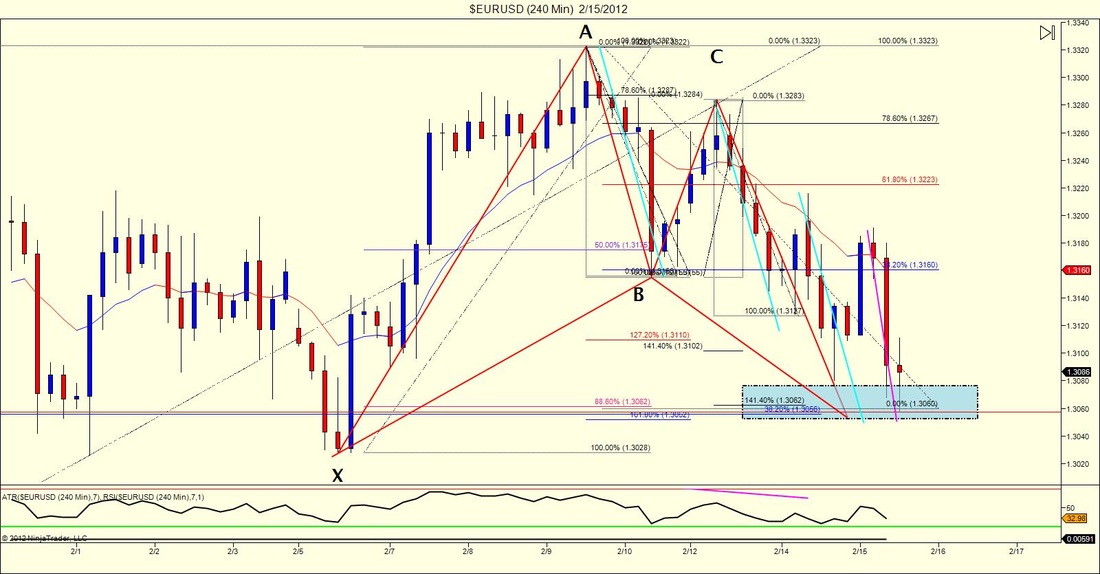
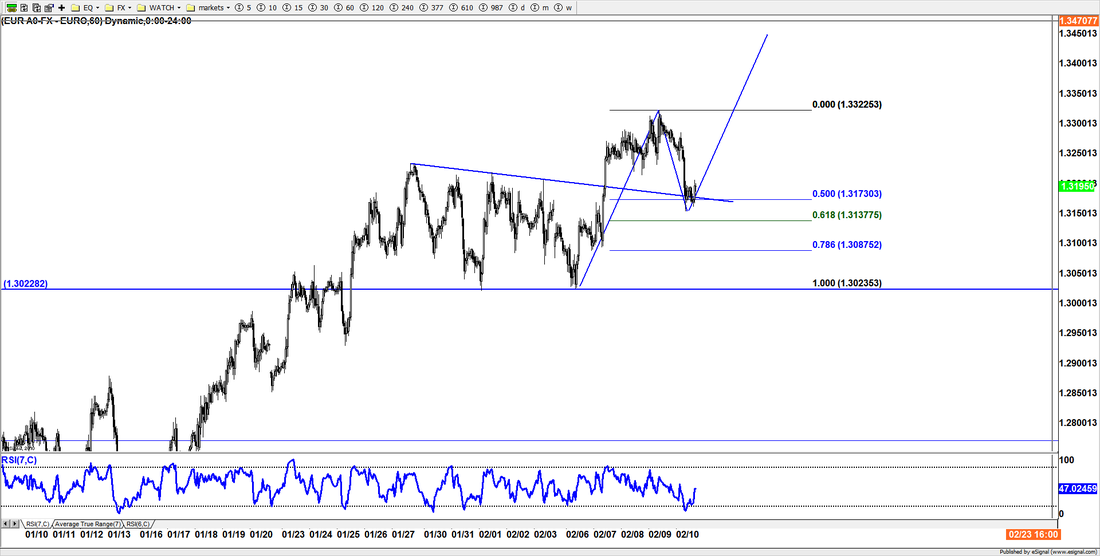
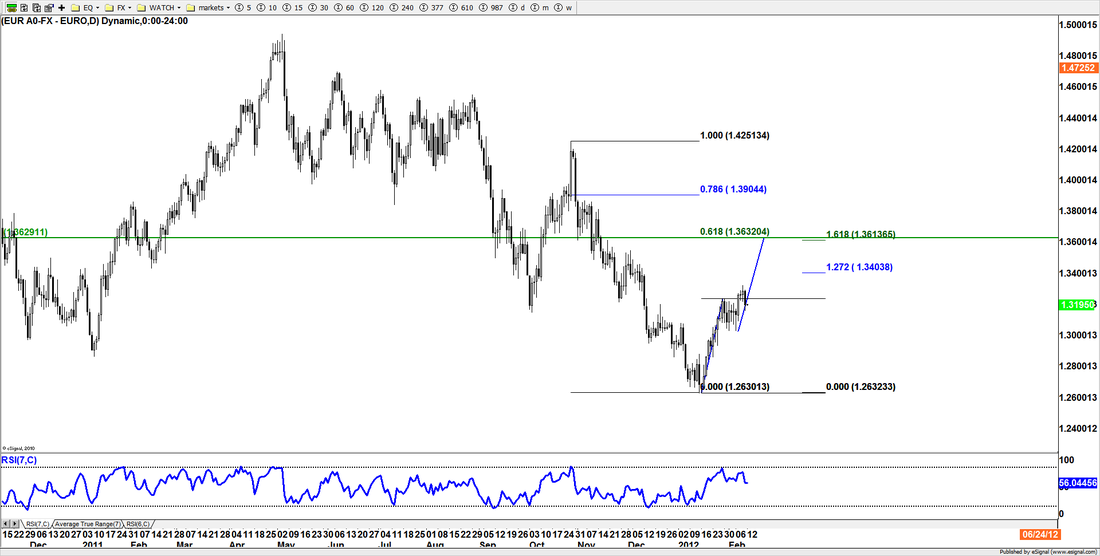
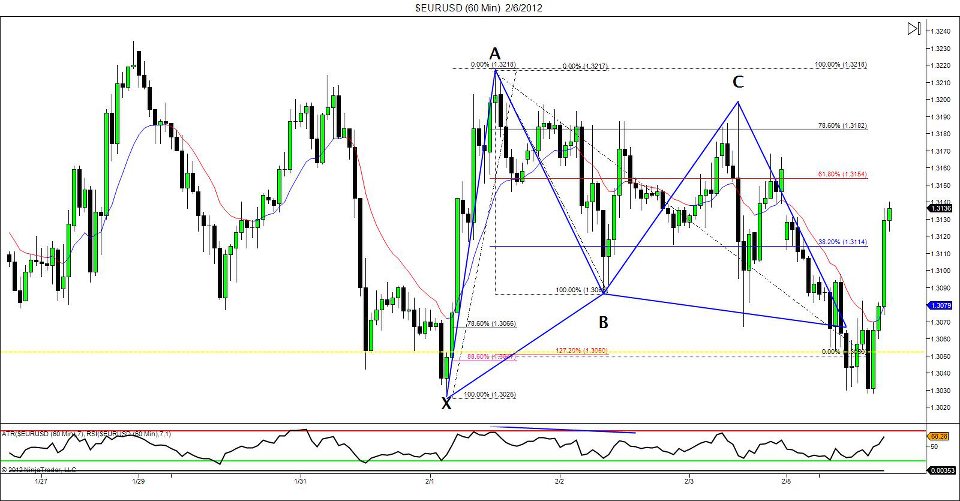
If there were ever a trade where we could predict a zone that the market would struggle to break through this would be it. Here is a chart of the EURUSD that we identified yesterday in the Live Room. As you can see by the chart there is a lot going on. We have a bullish bat pattern in red, a four drives pattern in light blue and even an ab=cd at the end. Hmmm...and guess what, they all end in the same area. I probably could have thrown a few more fibs on there to make it look even better but that would simply make this chart even more crowded than it always is.
Here is an email I got from a trader friend of mine showing me some of the stuff he identified in the market. Practice makes you better in this field so he is constantly going back through charts identifying different setups that may have occurred. It's funny he sent this because for the past week I've been meaning to write a post relating trading to sports. Hope you enjoy!
From Andre:
The metaphor I use is, whether you have a bad or good week, the way to stay fit as a harmonic trader is to continually and relentlessly keep hittin the gym... which means keeping going to the markets to see how they have behaved harmonically!
Only then can you step into the ring or the arena with confidence.
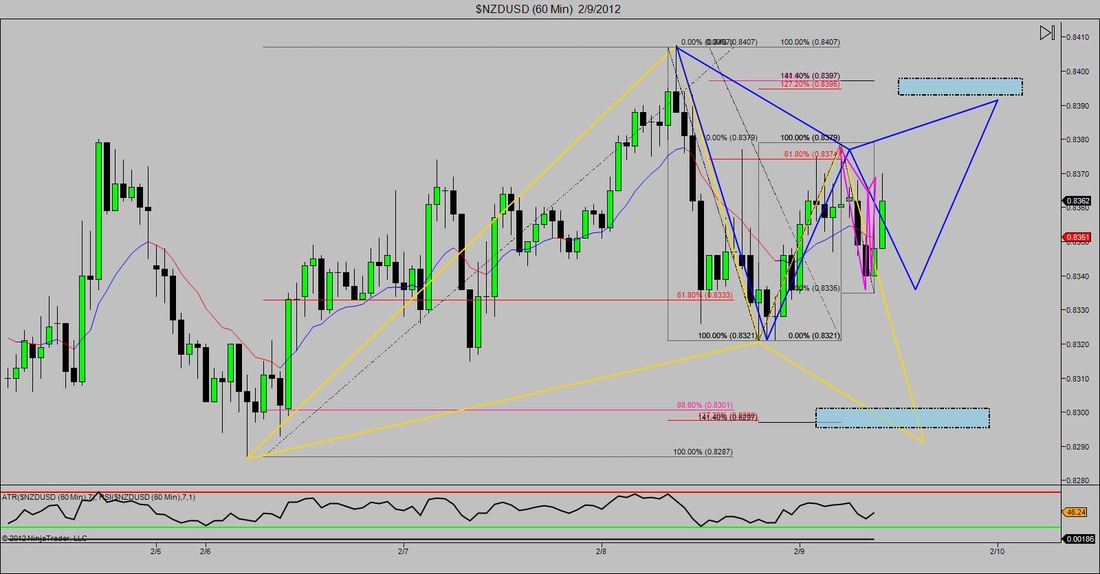
I wanted to do a post about this chart because, well it's pretty interesting. We identified this or these possible trade setups in the Live Room earlier today, unfortunately none of them were triggered by the end of our session. Anyways, what you have above is a chart that contains 3 Gartley patterns. Yes...three! We have a potential bullish gartey in gold, a potential bearish gartley in blue, and a smaller gartley that actually completed on the 5min chart in pink. During the session I got the question "Akil, how do you decide which one to take?" And I answered "whichever one the market gives us." In a situation such as this the proper move to do is to simply wait and see which direction the market decides to go and then take advantage of it. Who knows one cold be completing r
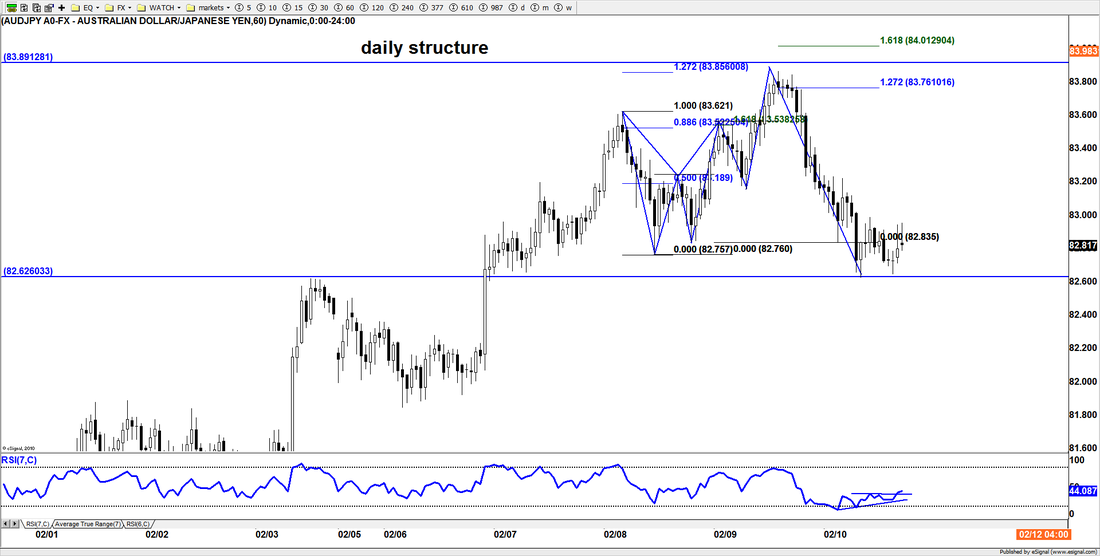
No live room today but I wanted to recap a trade that I called Friday in the live room. It doesn't look pretty by any means (trust me when I say it looked a little better on Friday) but there was was Bullish Gartley forming on the EURUSD 1hr chart. We had an entry called out right above the 88.6 & 127.2 extensions and last night or this morning (depending on where you're located) our orders were filled. Because it was the weekend, traders often take there resting orders so many people may have missed this opportunity. Luckily for us the market also gave us another opportunity to get involved by forming a double bottom with RSI divergence right at structure. For those in the room, Pro Trader clients or members of the Founders Series you''ll know that all of these factors added together gave us an excellent CTS score with a phemonial risk reward ratio. The market leaves clues and tells us when money is laying there on the table waiting to be grabbed, we just have to pay attention and pick it up.
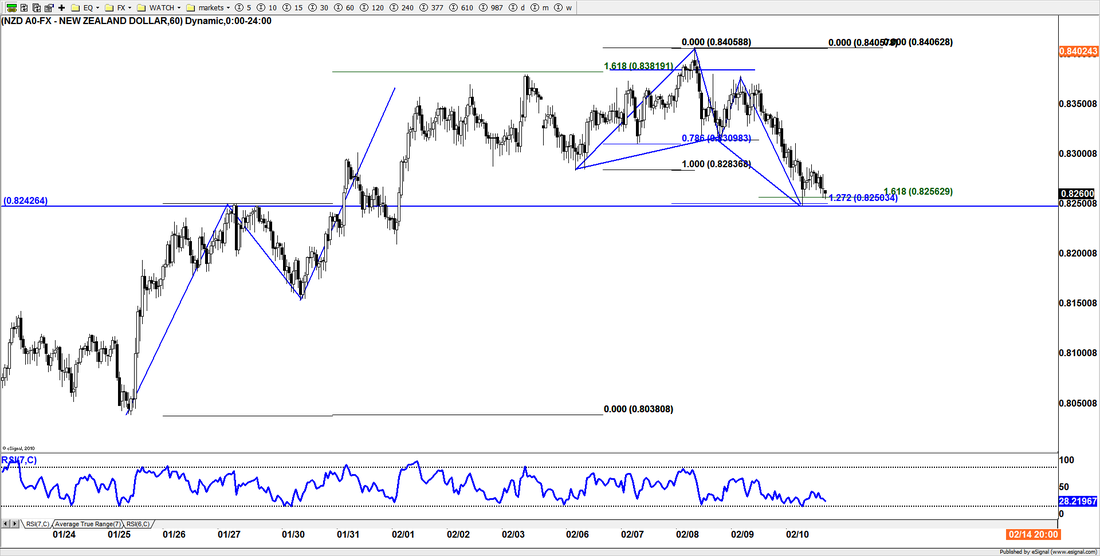
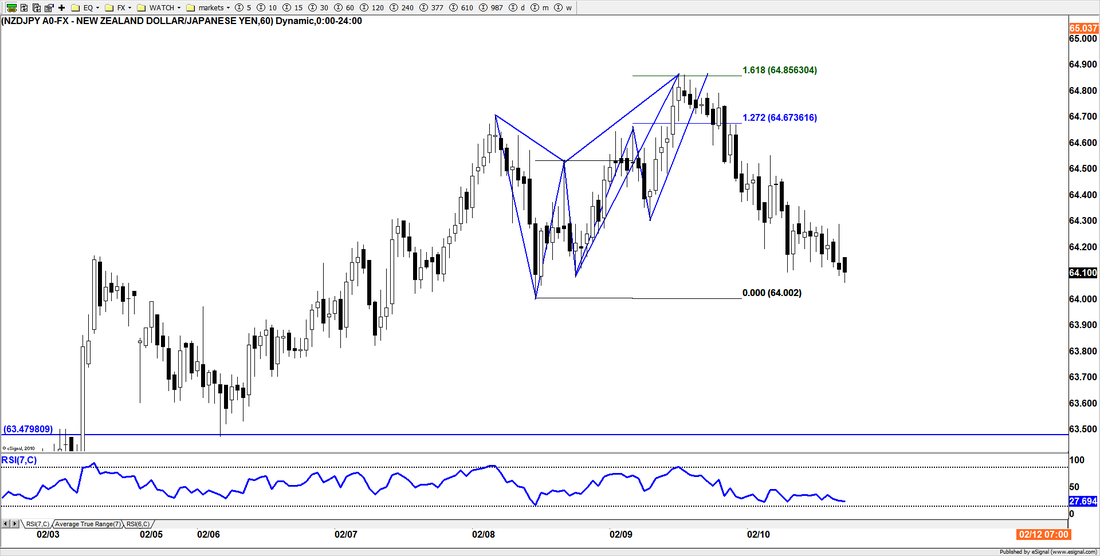
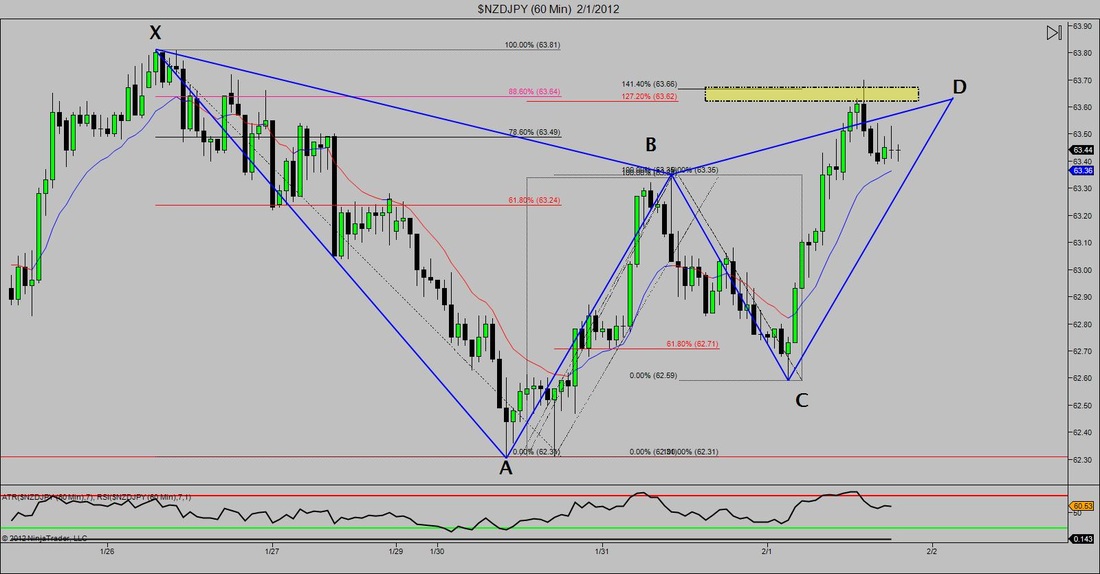
This morning I saw an interesting post by one of my good trader friends. In this post he mentioned that he accidentally took all of his profits out of a higher term timeframe and due to his rules he couldn't simple re-enter. The pattern he was talking about was a Bat pattern that completed on the NZDJPY Daily/4hr chart (right). However, when he went down a couple timeframes he noticed that a Gartley pattern was forming on the same exact pair that completed at (or close to) the same completion area as the bigger bat. Pretty interesting, and as some of the members of the live room said, another chance to get involved if you missed the initial move.


 RSS Feed