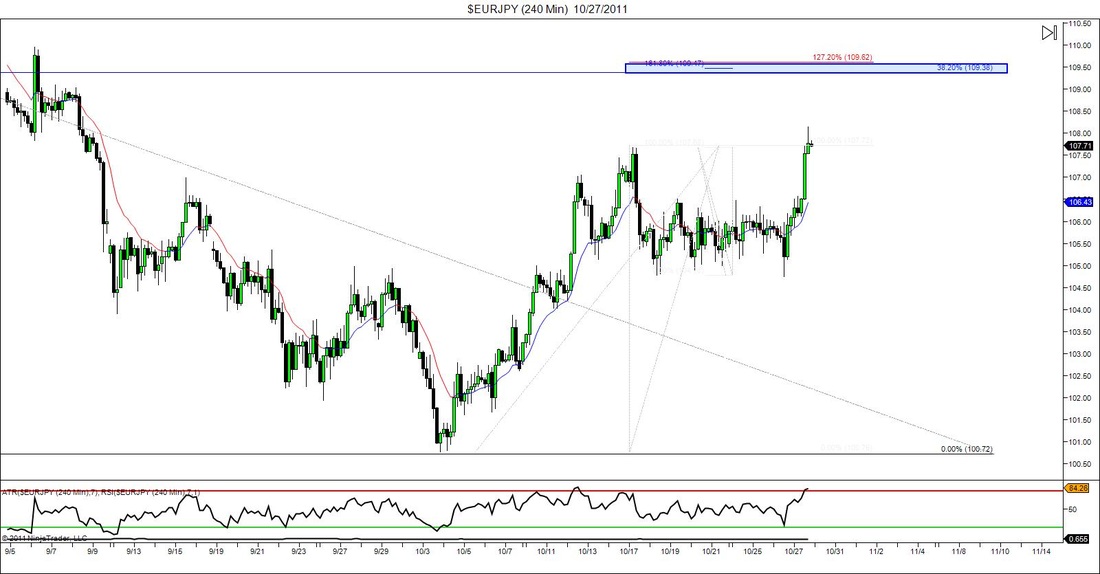
It has been awhile since I've posted anything, but in all honesty there hasn't been much going on in the market, unless you're a channel trader, then you've probably had a field day with some of these pairs. Anyway, things finally seemed to start moving again over the past few days and while going through my PM analysis I noticed a potential reversal zone to watch on this chart. Now in no way am I saying or predicting that the market will indeed reverse at this point but there is some interesting Fibonacci ratio confluence between the 109.40's & 109.60's area. The Fibs I took were a the 1.272 extension the the most recent up move (A-B) & a 1.618 inversion of the retracement of that move (C-B). There is also a 0.382 retracement of the latest down move measured from a daily chart. Obviously you can't see it on this chart but trust me it's there. Do I have a sell limit placed at this zone?....Nope. But I will be keeping my eye on it and keep building my entry reasons as/if price action decides to reach it. There is some minor support near that zone as well which is a plus, but on the down side, if this pattern decides to complete a C-D move that is equal to A-B (giving us an AB=CD pattern) then that will take us to a much higher level which has some very good structure of it's own. We'l just have to wait and see what happens.
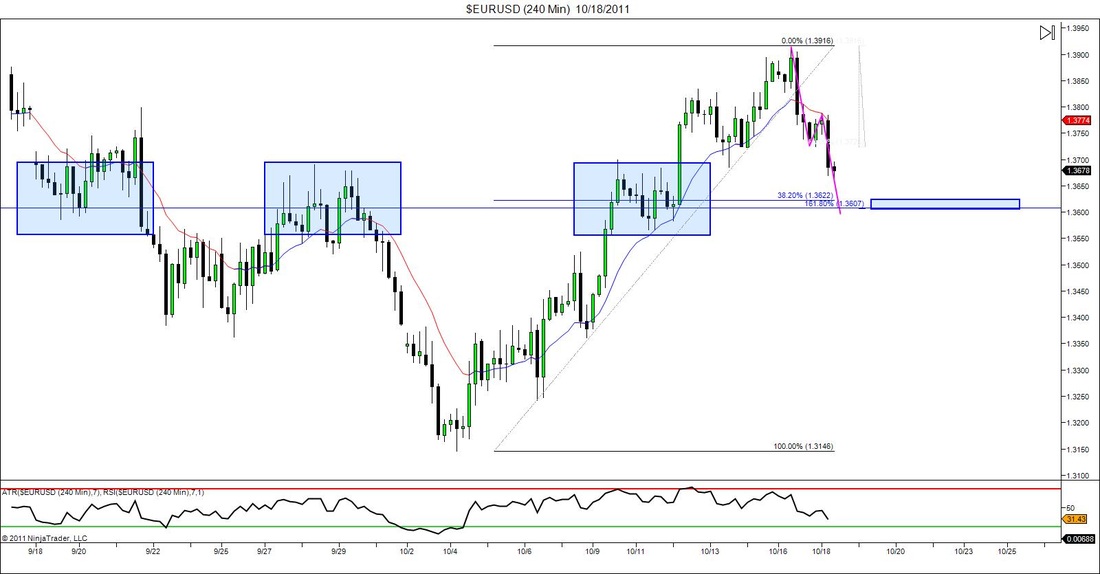
Not much in the market I'm excited over but that doesn't stop me from drawing in lines and practicing my technical analysis. After-all it is a skill. Anyway with this chart I simply drew in a "What If" AB=CD pattern and saw that would indeed complete at a 1.618 fib extension which is always a good sign. this extension also lines up in an area very close to a 38.2 retracement level of the impulse leg to the left. Add to that there is a past history of market choppyness or structure. Nothing really dead on but as a whole that area looks prime for something. I personally don't have anything in my rules to trade this strictly on what I see now. But if price action does get down to that general area I will switch down to a lower time frame and see if I can catch a double bottom and get involved. If not then I just sit back and watch and call in a learning experience. My goal is not to lose money so if I'm not 100% comfortable with a trade set up I simply sit back and watch.
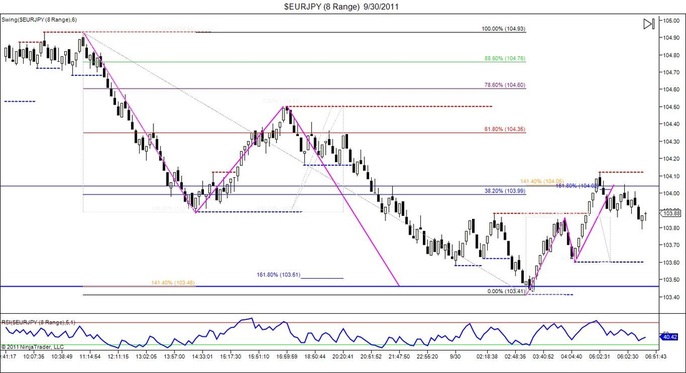
If you don't believe in the power of ratio's and market harmonics juts take a look at this chart. All of this happened before I was awake this morning, but if you follow the pink lines you'll see a larger AB=CD pattern completing at a 141.4 fib extension & 161.8 fib inversion zone, only to be followed by a smaller AB=CD pattern that completes at similar ratio confluence. Amazing how this stuff occurs. All that's needed is the skill to recognize it beforehand and the confidence to trade it. And a good set of rules of course.
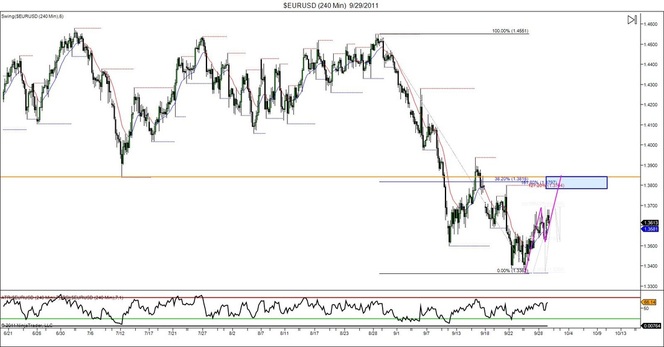
Not much on the table for me trade wise today. Got stopped out for small profits on the 2nd targets of 3 trades last night. So today it's time to refocus and analyze for the future once again. IF this AB=CD pattern completes (we never know of course) it should end at a point of major support (1.3840's) This could be a great place to start looking for reasons to get short if the opportunity presents itself.


 RSS Feed