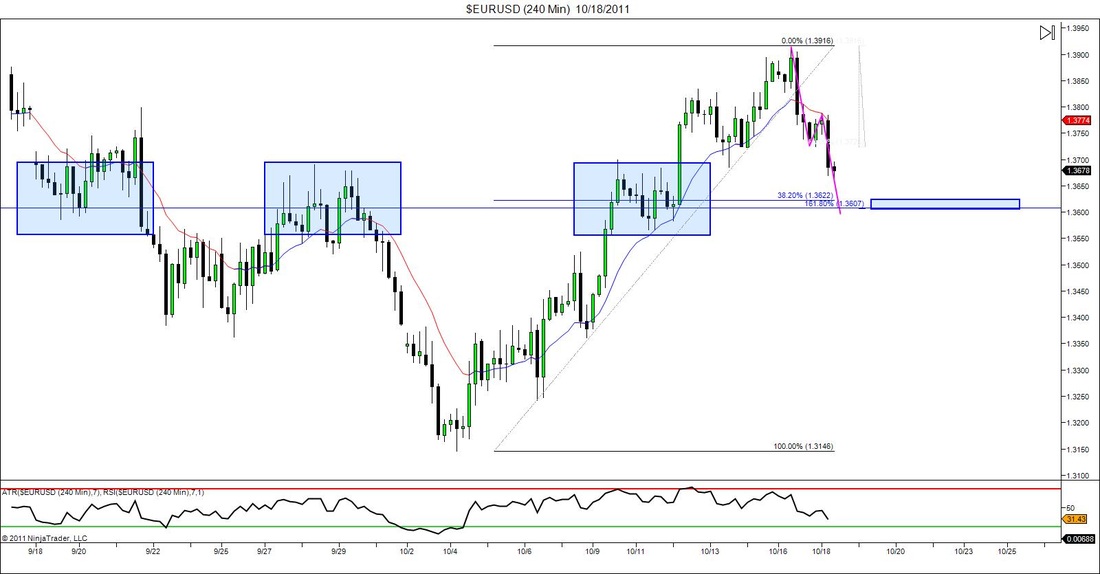
Not much in the market I'm excited over but that doesn't stop me from drawing in lines and practicing my technical analysis. After-all it is a skill. Anyway with this chart I simply drew in a "What If" AB=CD pattern and saw that would indeed complete at a 1.618 fib extension which is always a good sign. this extension also lines up in an area very close to a 38.2 retracement level of the impulse leg to the left. Add to that there is a past history of market choppyness or structure. Nothing really dead on but as a whole that area looks prime for something. I personally don't have anything in my rules to trade this strictly on what I see now. But if price action does get down to that general area I will switch down to a lower time frame and see if I can catch a double bottom and get involved. If not then I just sit back and watch and call in a learning experience. My goal is not to lose money so if I'm not 100% comfortable with a trade set up I simply sit back and watch.
0 Comments
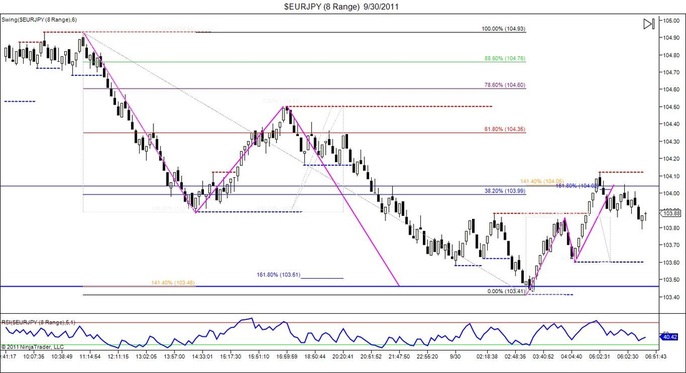
If you don't believe in the power of ratio's and market harmonics juts take a look at this chart. All of this happened before I was awake this morning, but if you follow the pink lines you'll see a larger AB=CD pattern completing at a 141.4 fib extension & 161.8 fib inversion zone, only to be followed by a smaller AB=CD pattern that completes at similar ratio confluence. Amazing how this stuff occurs. All that's needed is the skill to recognize it beforehand and the confidence to trade it. And a good set of rules of course.
|






 RSS Feed