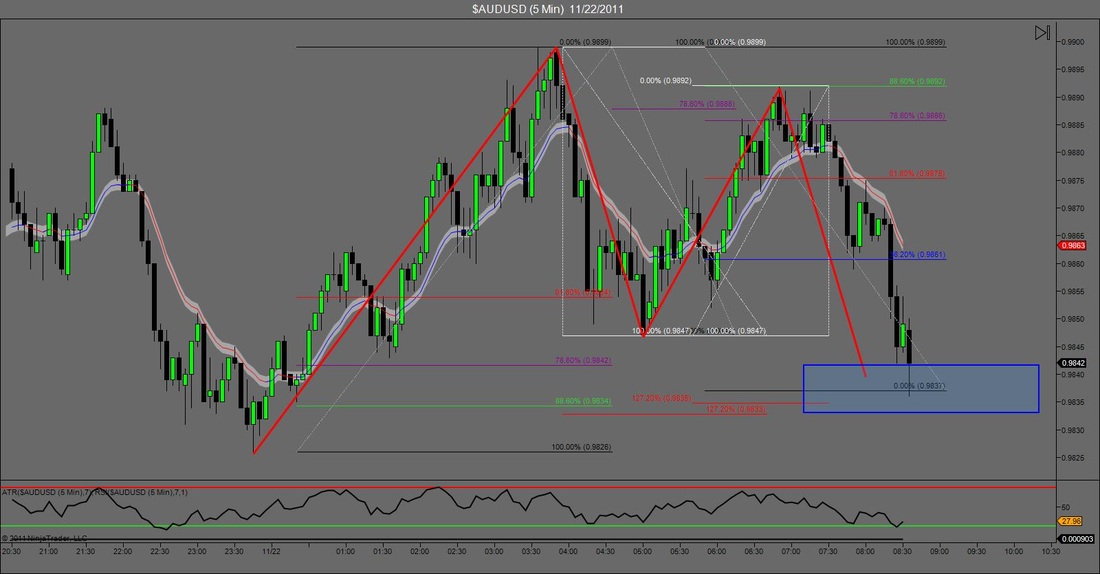
Got 2 charts for you guys to look at today. We'll start with the lower timeframe one. Above is the AUDUSD on the 5min chart and what we have is a Gartley Pattern. However because of the retracements the AB=CD completion and the ratio's don't line up with the best confluence. If you look closely the AB=CD lines up pretty good with the 78.6 retracement which is what we want to see. However the 1.272 extension line sup closer with the 88.6 retracement. So the question is where do you enter? Well there is a simple answer to that. In the voice of my trading mentor Jason Stapleton "what do your rules say?" In this case my rules tell me to enter at the location with the most confluence and if you look at the chart it should be pretty obvious where mine went. Luckily, I barely got filled with mine, placing them at the 88.6/1.272 area (+spread). Unfortunately, the trade ended up as a loser, but I was able to get involved at the area that presented me the least amount of risk.
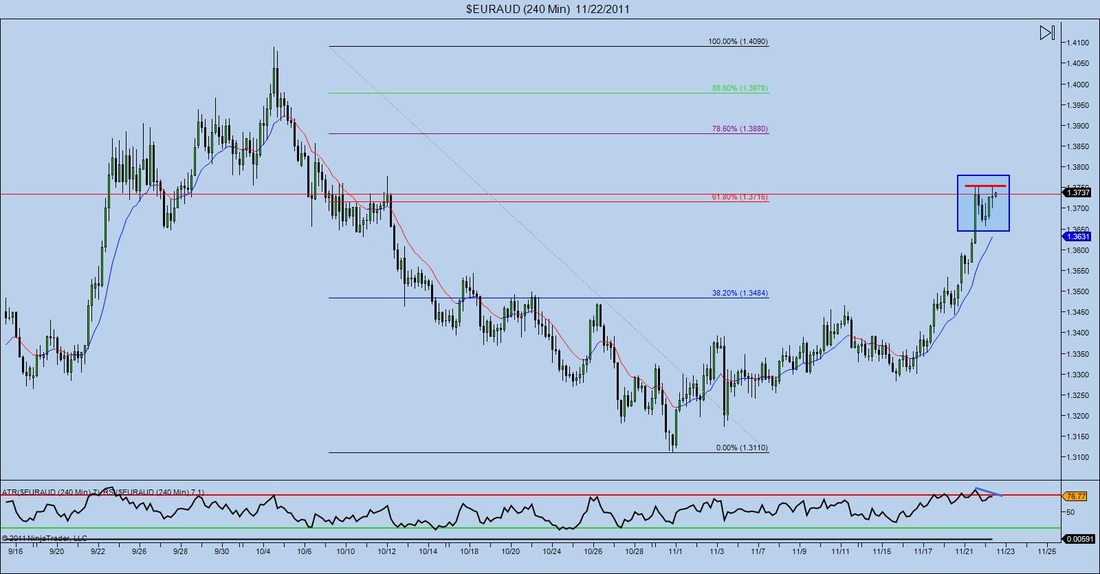
The chart below is the EURAUD on a 240 min chart. It may be hard to see, but a nice double top has formed, presenting the opportunity to get short. However, this trade is a lot more risky than the one above because there is not much more to it. The only ratio we have around it is the 61.8 retracement from the last bearish move. But there are no Fibonacci extensions that line up with it, nor is there any major structure or an AB=CD pattern. So depending on how aggressive of a trader you are, this may or may not be a good opportunity. On the bright side we have a double top (as mentioned earlier) along with the RSI being overbought with divergence on the rest-test. So is this a valid entry? Well you tell me.
The chart below is the EURAUD on a 240 min chart. It may be hard to see, but a nice double top has formed, presenting the opportunity to get short. However, this trade is a lot more risky than the one above because there is not much more to it. The only ratio we have around it is the 61.8 retracement from the last bearish move. But there are no Fibonacci extensions that line up with it, nor is there any major structure or an AB=CD pattern. So depending on how aggressive of a trader you are, this may or may not be a good opportunity. On the bright side we have a double top (as mentioned earlier) along with the RSI being overbought with divergence on the rest-test. So is this a valid entry? Well you tell me.


 RSS Feed