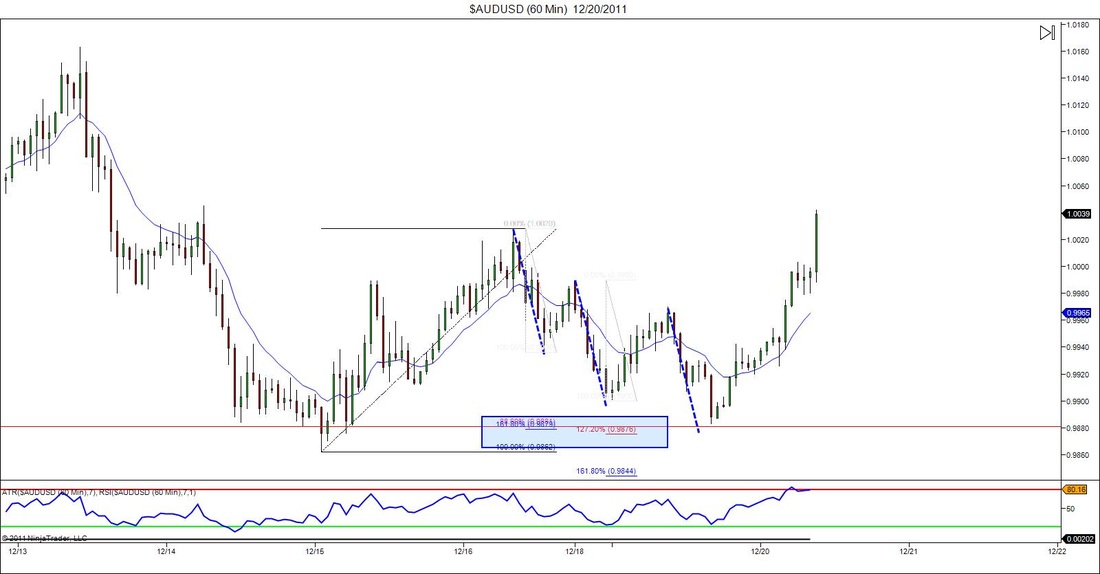
Last night a fellow trader named Andre sent me a few charts which demonstrated some pretty awesome harmonic moves in the market. One of those charts was the AUDUSD, so this morning I decided to bring it up on my computer and take a look at it. Andre noted a perfect 3 drives pattern as noted above but as i did some more analysis I also saw that the final drive ended at an area with some pretty good ratio confluence. And by pretty good I mean a 1.618 extension of A-B, a 1.272 extension of CD, and a 88.6 retracement of what would be XA.  And as you can see price action reversed and skyrocketed off of that point. All I can say is Nice!
12/20/2011 11:27:27 am

That was a nice looking pattern!!! Unfortunately, I've decided to cease my operations for the year though to get ready for 2012... on any other day I would have taken that one... I developed a really cool way of mathematically defining those technical opportunities with a scoring system I know you will find very familiar. It took me 12 months to put it together, and if you go to my blog, and request the "Free Spreadsheet" on the right hand side of the page, then you can download a free copy of the application for yourself. I call it the ProTrader Dashboard. It would be really cool to get some feedback from somebody who knows what they're talking about...

Reply
Akil
12/20/2011 11:24:00 pm

I'm done too, so I'm just an observer in the markets as well. Figure practice never hurt anybody. I'll give your site a look later on today

Reply
6/24/2012 06:43:29 pm

This is the perfect blog for anyone who wants to know about this topic. The article is nice and it is pleasant to read. I have known very important things over here.

Reply


Leave a Reply.