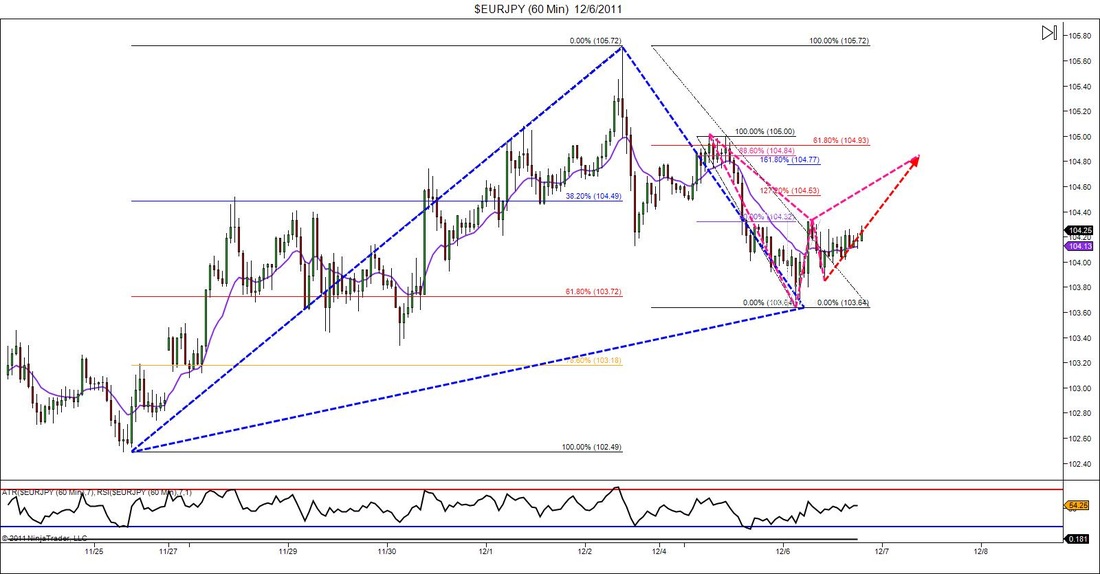
While going through my nightly analysis of the market I noticed something pretty interesting. First of all whenever I analyze charts I start from a higher time frame then work my way down. So when i was looking at the EURJPY on the 4hr chart I noticed the 1st leg of a potential Gartley pattern. At this point having the X to A and A to B legs mean nothing trade wise, but I always like to mark them down so I don't lose track of them. When I went to a lower time frame I noticed another potential advanced pattern, this time a Bat Pattern that would complete at the exact point that I would predict the next leg of the bigger pattern to turn around at. Trade wise this doesn't give me any more or less reason to enter, but it is interesting to see the possible confluence between patterns and time frames. One good thing is if the market doesn't decided to complete at that area, then I do have a great idea of where the market would want to go next.


 RSS Feed