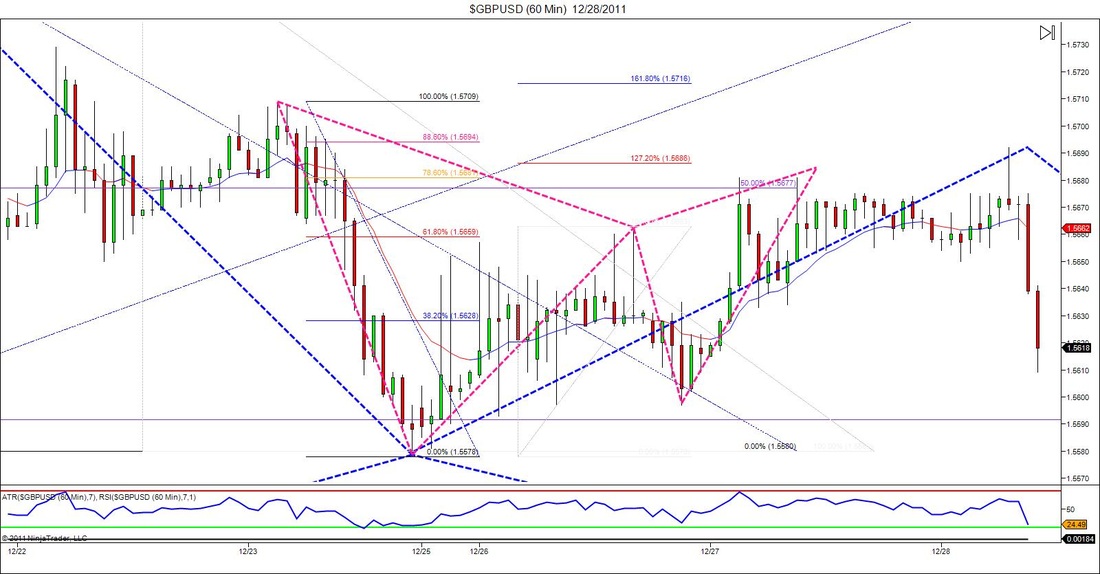
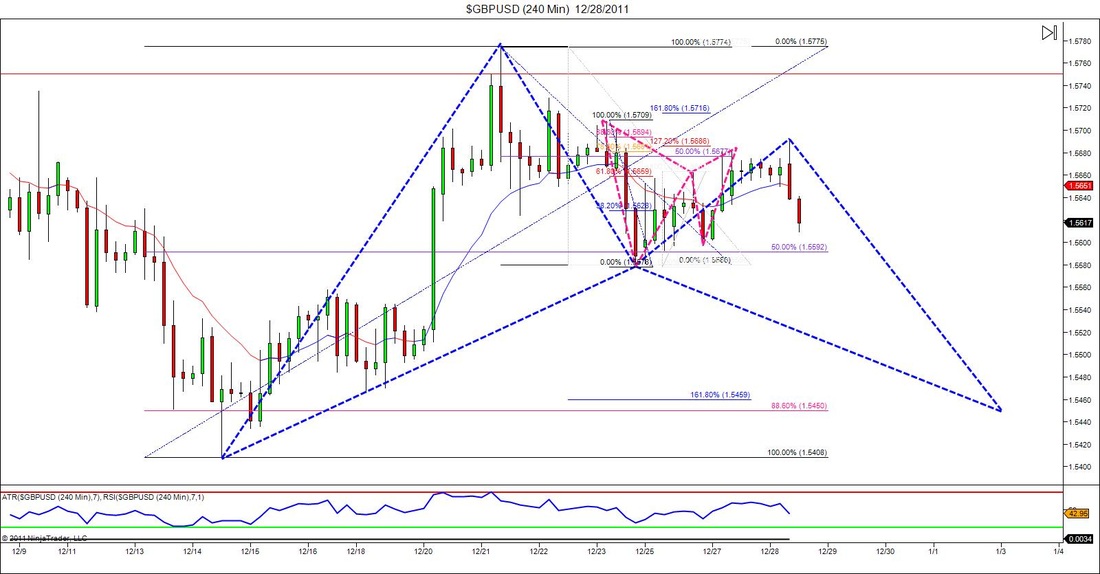
Both of these chart are from patterns that I saw on the GBPUSD. The chart above is from the 1hr chart and the below chart is of the 4hr. When doing some analysis yesterday I originally first noticed a pretty good potential bat pattern forming on the 4hr chart. However, since it was a ways away from completion I simply drew out my prediction and continued to zoom down a timeframe to look for any smaller moves. (I'm still not trading live until the new year, but I wanted to get back in the groove or routine of my analysis so I don't have any rust come Jan. 3rd.) When I went down to the hourly chart I saw a legit Gartley completion that had not quite hit my would be entry point which was a difference between the 78.6 retracement and the 127.2 extension. Price action actually bounced right off of the 50% retracement of the bigger Bat pattern which is why I liked this smaller pattern even more. When I checked back this morning I noticed that price came back and retested that area, and although the retest failed, the wick on the high candle would have gotten me filled on my Gartley entry. I didn't check the fibs on this thing yet but just from eyeing it up it looks like my 1st target would have been hit, which means stops would be moved to breakeven and all of the potential pain would have been erased. :-)


 RSS Feed